Safari Developer Tools
In this section:
Overview
Safari Mobile
Safari for Mac OS X
Overview
Safari 3.1 and later contains several tools to help you debug websites and web applications.
Safari Mobile contains a debug console that can be enabled to assist in debugging websites and web applications directly from an iPhone or iPod touch.
The tool set for Safari on the desktop or laptop is far more extensive. You can, for example, do any of the following things:
Change the Safari user agent string.
Get a report of errors that Safari detects in your HTML or JavaScript, and see how Safari attempted to deal with HTML errors.
See a graphic download timeline of your website, showing the order in which resources load, and how long each takes.
View the source of HTML, CSS, JavaScript, and other resources.
View the DOM hierarchy and examine the styles, properties, and screen metrics for any element in the hierarchy.
Click a particular element on a web page, and immediately see its place in the DOM, its CSS properties, and its screen metrics.
Search the source of multiple documents on a website for a string.
Write a snippet of HTML, CSS, or JavaScript and see how Safari (or any WebKit-based application) interprets it, in an interactive window.
Disable caches, images, styles, or JavaScript.
Safari Mobile
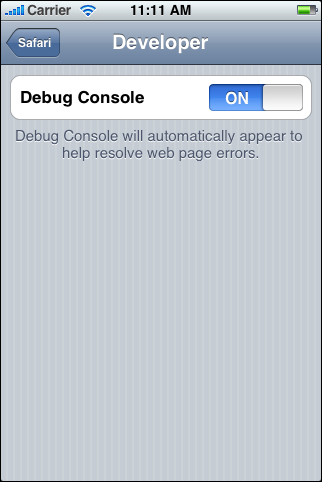
You can enable a debug console in Safari Mobile which allows you to see HTML, CSS, and JavaScript errors directly on the iPhone or iPod touch. To enable the console, touch the Settings icon on your iPhone or iPod touch, then choose Safari and scroll down to the bottom of the screen, then touch Developer. From here you can turn the console on or off, as shown in Figure 1-1
Once the debug console is enabled, Safari mobile records any errors it encounters when accessing a website. A Debug Console report appears at the top of any displayed web page.

If there are no errors, the words “No Errors” are displayed. If any errors are encountered in the HTML, JavaScript, or CSS, the number of errors is displayed, followed by a right carat. Touching the carat brings up the debug console.
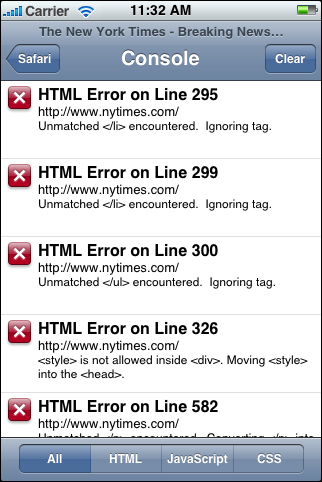
A scrollable list of errors is displayed. You can choose to see all errors, or limit the display to only the HTML, JavaScript, or CSS errors. The line number on which the error occurred is displayed, along with a terse description of the error.
If you choose to see JavaScript errors, you also see JavaScript log events. All output from the JavaScript functions console.log(), console.info(), console.warn(), and console.error() are logged to the Debug Console. By judiciously placing log entries into your JavaScript, you can trace the code path that executes on an iPhone or iPod.
Note: Currently, long log entries are truncated to fit the space available on the mobile Debug Console. For best results when using the mobile Debug Console to track JavaScript log events, keep your log entries terse.
Safari for Mac OS X
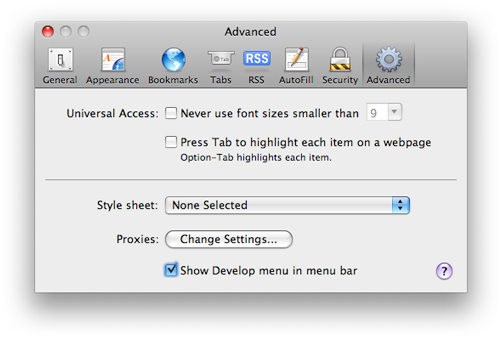
You enable the developer tools in Safari for Mac OS X by turning on the Develop menu. From the Safari menu, choose Preferences. Click the Advanced tab, then click the checkbox labeled "Show Develop menu in menu bar", as shown in Figure 1-2.
This adds a Develop menu to your menu bar (Figure 1-3). Safari's developer tools are now enabled.
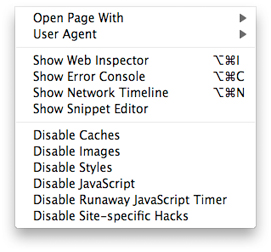
The remainder of this chapter describes the Develop menu's features in detail.
Open Page With
When testing a website, you typically open it in several browsers, such as Safari, Internet Explorer, and Firefox, to make sure that it works correctly in all cases. "Open Page With" is a convenient way to open the current web page in another browser, without having to leave Safari, open the other browser, and navigate to the page.
User Agent
Every browser has a user agent string that identifies its browser type and version number. Your website can read the user agent string using JavaScript. This is the usual way to determine what version of which browser a user is running. You can choose what Safari reports as its user agent from the User Agent submenu. This can be useful to quickly test your code to see if it is reacting to different user agents as you expect, without having to actually load the page in multiple versions of multiple browsers. The user agent menu is shown in Figure 1-4.
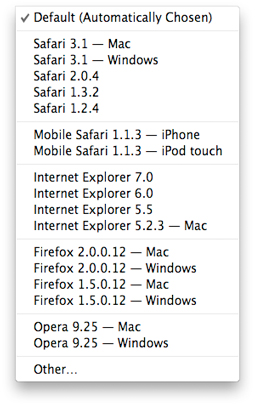
You can choose the common versions of most popular browsers without having to type in the actual agent strings by choosing them from the submenu. Note that the list includes the mobile versions of Safari found on iPhone and iPod touch.
The "Other..." menu choice opens a sheet, as shown in Figure 1-5.
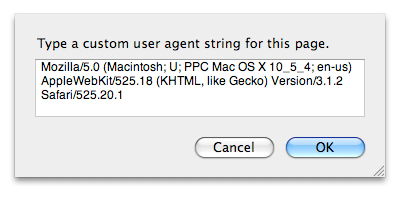
This sheet displays the currently selected user agent string and allows you to modify it. This allows you to enter the strings for less common browsers or versions, or to enter a customized string that identifies this as a unique browser.
Tip: By entering a unique user agent string, you can use it to trigger code that you want to test on your website live, but without exposing it to the public.
Web Inspector
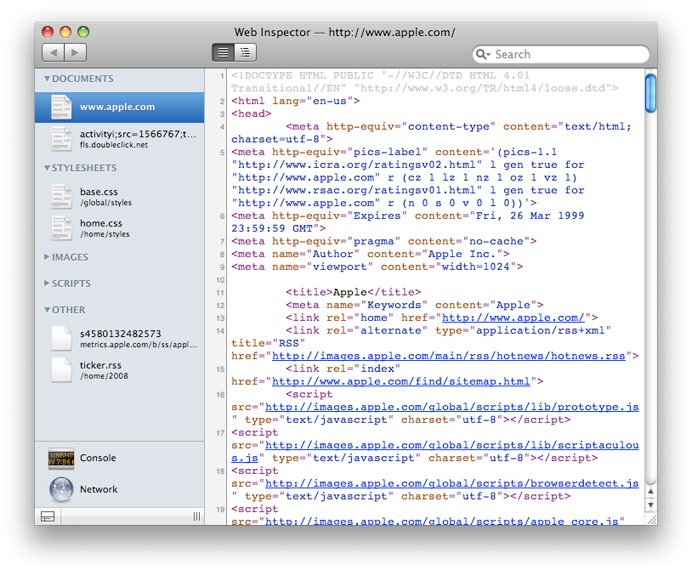
The Web Inspector is the most powerful and versatile part of the developer tool suite. Choosing Web Inspector from the Develop menu opens a window with a sidebar containing a collapsible source list of HTML documents, CSS styesheets, images, scripts, and other resources (such as movies and Flash content), as shown in Figure 1-6.
If errors are detected in an HTML or JavaScript file, the number of errors appears beside the file name in red. To view errors, use the error console, as described in “Error Console.”
Click any title in the source list to display the contents of that resource in the main pane of the Web Inspector window. This allows you to view not only HTML source, but the source code for all the CSS style sheets and JavaScripts in use, as well as the output from server-side scripts.
Clicking an image in the source list shows you the image and displays its height and width, along with the filename, file size, and the MIME type reported by your server.
When viewing an HTML document, a two-position control appears at the top of the main pane that allows you to switch between viewing the HTML source and the DOM tree, which is displayed as a collapsable hierarchy.
DOM View
The DOM view shows you the DOM that WebKit has created in memory, based on your HTML, JavaScript, and other resources. When viewing the DOM tree, you can select an element and see all the CSS styles applied to it, its positional metrics, such as height, width, margins, and padding, and all the properties associated with it. An example of the DOM view is shown in Figure 1-7.
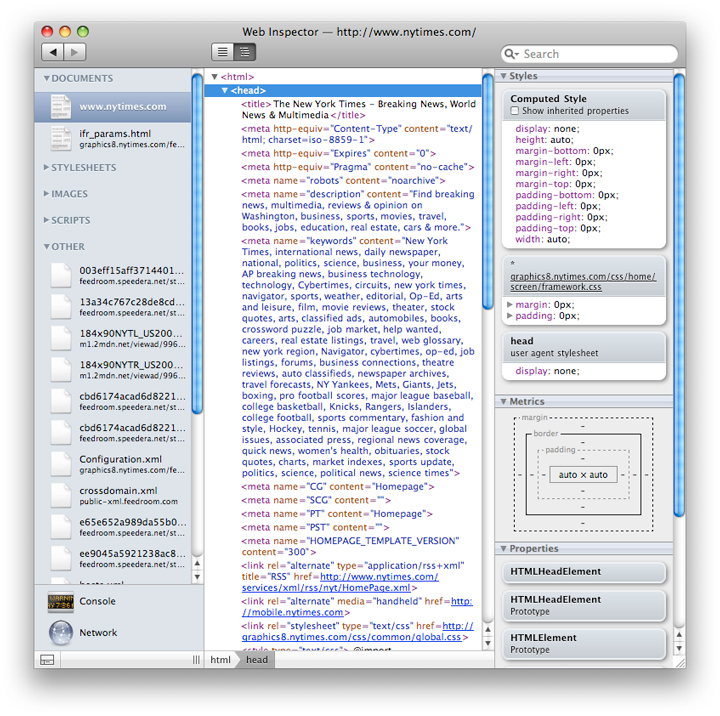
Using the DOM view, you can see the result of changes to the DOM made by JavaScript, as well as all the styles applied to a given element. This is one of the more powerful features of the Web Inspector.
Search Field
Entering text in the search field in the upper right of the window invokes a search for that text across all files listed in the sidebar. A list of matches, sorted by file, appears at the top of the pane. If you click a file in the sidebar, the source for that file appears under the list, with the first occurrence of the text scrolled to the top and highlighted. If the file is an HTML document, you can toggle between source view and DOM view.
Tip: You can use the search field to quickly find the places where a style is defined and used in all the resources that contribute to a given web page.
Docking
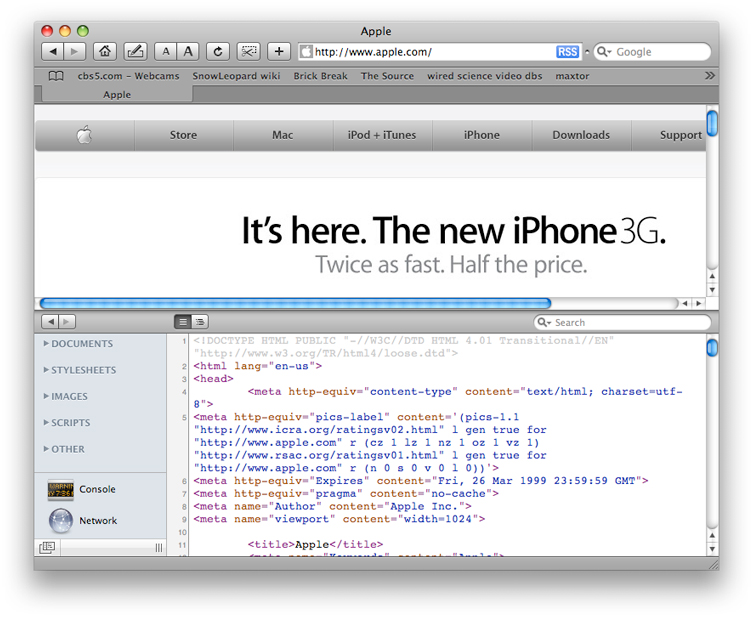
At the bottom left of the Web Inspector window is an icon of tiled rectangles. Click this icon to dock the Web Inspector with the main browser window for a more compact workspace. Safari displays the current web page in the upper pane, and the Web Inspector in the lower pane. An example is shown in Figure 1-8.
Error Console
You can open the error console by choosing “Show Error Console” from the Develop menu or pressing the hot key combination shown in the menu, or you can click the Console icon in the sidebar of the Web Inspector.
When the error console is open, it shows you all HTML errors that Safari encounters and indicates how Safari attempted to deal with the errors. The error console also shows any errors detected in JavaScript. Most common problems with websites can be easily diagnosed and corrected using the error console.
Note: The error console must be open when website is loaded in order to display errors. If you open the error console after a page has loaded, the display is blank; reload the page to see any errors.
The error console is illustrated in Figure 1-9.
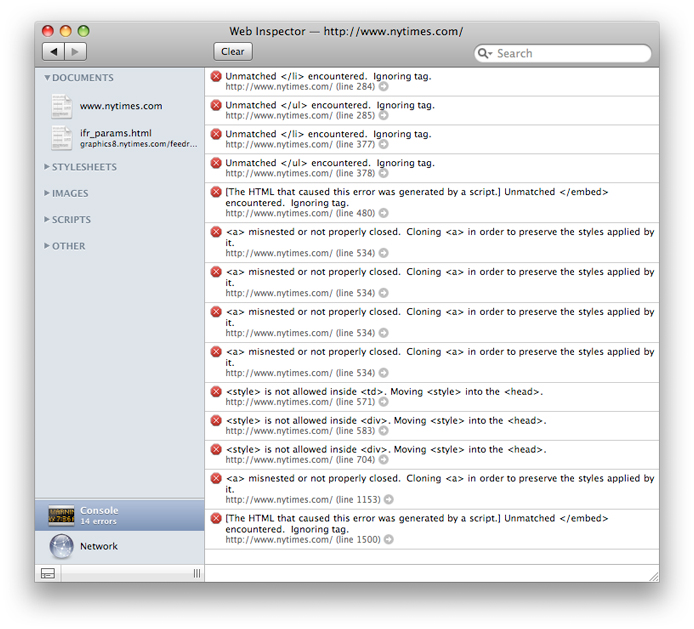
Each error is shown, followed by a description of any corrective action that Safari took, the URL of the resource that contained the error, the line number on which the error occurred, and a right-arrow icon. Clicking the icon opens a view of the source, scrolled to the indicated line.
Important: Not all browsers deal with a given error in the same way. Always check your website for errors, even if it displays correctly.
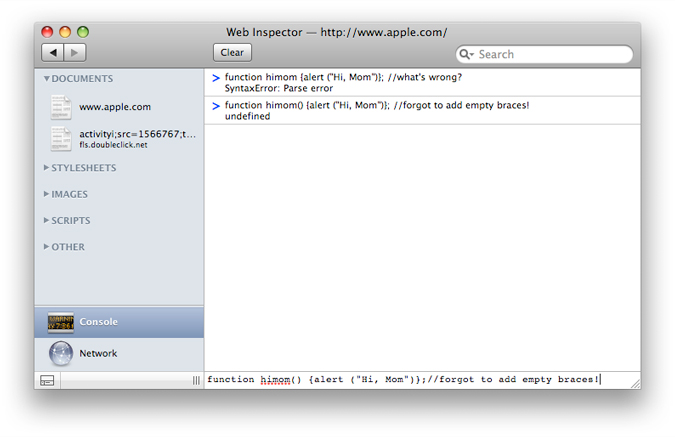
You can also use the error console interactively to debug JavaScript errors. This is a lot faster and easier than editing the script, uploading it to your site, and reloading the site in the browser. If the error console shows a JavaScript error, you can simply retype the offending line of code at the bottom of the console window, modifying it until it works correctly. Click at the very bottom of the console window, under the separator line, to enter text. An example is shown in Figure 1-10.
Network Timeline
Open the network timeline by choosing “Show Network Timeline” from the Develop menu or pressing the hot key combination shown in the menu, or by clicking the Network icon in the sidebar of the Web Inspector.
The network timeline shows you graphically how your website loads. The documents, JavaScripts, images, style sheets, and other resources are color-coded for easy reading. The order in which they loaded is displayed from top to bottom, with the duration going from left to right, showing any overlaps. An example is shown in Figure 1-11.
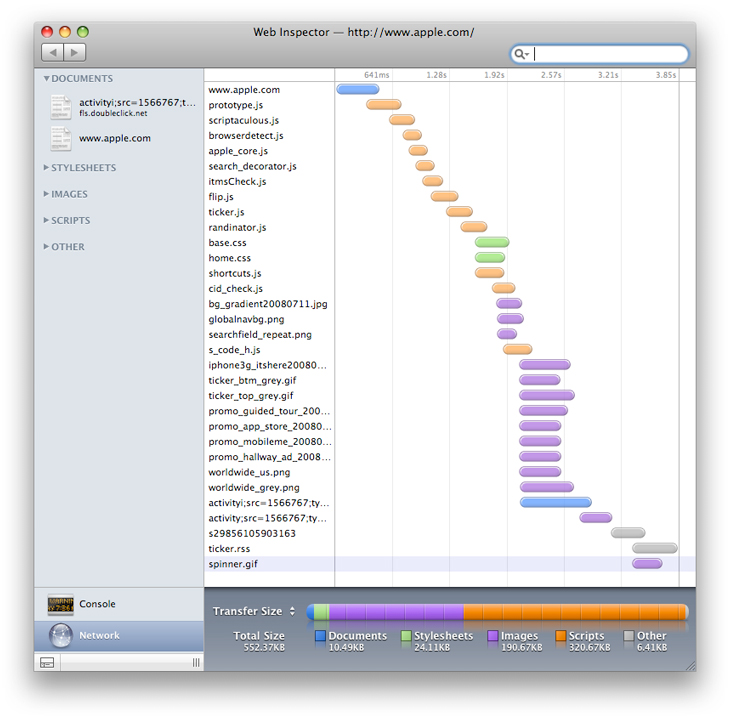
This makes it easy to see exactly how long it takes your site to load, and where any delays are occurring.
It also shows the order in which things load on your site. This can be helpful in a number of ways. For example, you can identify unintended serial downloads, where one document does not begin downloading until an unrelated document has completed (an example is a JavaScript that loads an image, when the image could be included in the original HTML).
Examining Individual Elements
There is an additional way to use the Web Inspector. You can control-click (or right-click) any element displayed in the browser window, then choose Inspect Element from the contextual menu. This opens the Web Inspector window, displays the DOM that Safari has constructed from your code, and highlights the element of the DOM that you clicked.
You can toggle the two-position control at the top of the main pane to switch between viewing the DOM and viewing the HTML source. The DOM view allows you to view all the styles that are applied to the element, its positional metrics on the screen, and its properties, as well as its position in the DOM hierarchy.
Note: This feature can be enabled in other WebKit-based applications by setting WebKitDeveloperExtras boolean true in the application’s plist file. From the command line, type defaults write app-bundle-id WebKitDeveloperExtras -bool true, replacing app-bundle-id with the application bundle ID of the WebKit-based application.
Snippet Editor
Choose Show Snippet Editor from the Develop menu to open the snippet editor. The snippet editor contains an upper pane, in which you can type HTML, CSS, or JavaScript, and a lower pane that shows how it will display in Safari (or any WebKit-based application), as shown in Figure 1-12.
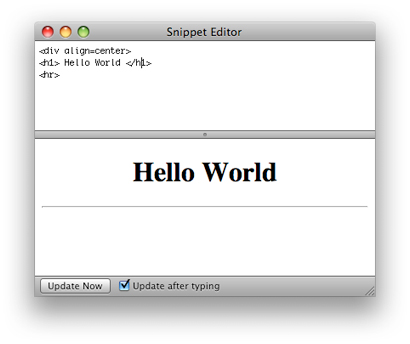
This provides an interactive interface for quickly prototyping or debugging your HTML, CSS, or JavaScript, without having to create complete HTML pages and open them in a browser, or to switch between your editor and browser repeatedly to edit the code and refresh the browser display. When your code produces the effect you want, you can copy and paste it into a working document.
If the "Update after typing" box is checked, the display pane is updated each time you press a key. This is ideal for working with short snippets of HTML or debugging the syntax in a line of JavaScript. For longer snippets, where the display of unfinished code would be distracting, uncheck the box and click the Update Now button to refresh the display when you are ready.
Disabling Selected Features
You can selectively disable caching, display of images, style sheets, and JavaScript to assist in debugging your code. You can also disable the runaway JavaScript timer—a timer that alerts the user and offers to halt JavaScript execution after a timeout in order to prevent an endless loop from hanging the browser.
Disable Caches
Choose Disable Caches from the Develop menu to disable caching of images and documents by Safari. This insures that the entire site is reloaded from scratch every time, without having to repeatedly empty the cache when you are updating the server frequently.
Tip: If your site occasionally displays oddly, but the problem is not repeatable, try disabling the cache. Sometimes elements are not loaded in the proper order, but the cache fixes the problem on subsequent loads. If disabling the cache causes the problem to be repeatable, you can use the error console and network timeline to further troubleshoot the error.
Disable Images
Choose Disable Images from the Develop menu to disable the display of images. This is useful to speed the display of an image-rich site over a slow connection or to simulate the display of a text-only browser.
Tip: Sometimes it is useful to disable images in an image-rich site that is not displaying correctly in order to view the skeletal layout of the page.
Disable Styles
Choose Disable Styles from the Develop menu to disable CSS style sheets. This allows you to see the unstyled content of the website. It also allows you to see what your website looks like if the style sheets fails to load, or if the site is viewed using a browser that does not support style sheets, such as a text-only browser.
Disable JavaScript
Choose Disable JavaScript from the Develop menu to disable the JavaScript interpreter. If your site is expected to work on browsers that do not support JavaScript, or for users who have JavaScript turned off, this is a good way to test it. Disabling JavaScript can also be useful for isolating script problems from HTML or style problems, or to speed the display of a JavaScript-intensive site when you are working on content or layout.
Disable Runaway JavaScript Timer
The runaway JavaScript timer prevents an endless loop in JavaScript from hanging Safari. If you are running a script that takes a long time to execute, and you encounter a dialog box that offers to halt the JavaScript, you can disable the timer that triggered the dialog by choosing Disable Runaway JavaScript timer from the Develop menu.
If disabling the timer solves the problem, you need to re-factor your script to be more granular in its use of time in order for it to work seamlessly with Safari or other WebKit-based applications.
Disable Site Specific Hacks
On occasion, Apple engineers may work with website developers by inserting special code in Safari to solve an urgent problem on a busy site, while the site developer works on the long-term solution.
If Apple engineers have modified Safari to temporarily address a problem with your website, and you are ready to test a newer version, disable the temporary code in Safari by choosing Disable Site Specific Hacks from the Develop menu.
© 2009 Apple Inc. All Rights Reserved. (Last updated: 2009-01-06)