Creating Custom Instruments with DTrace
The built-in instruments of the Instruments application can provide a great deal of information about the inner workings of your program. Sometimes, though, you may want to tailor the information being gathered more closely to your own code. For example, instead of gathering data every time a function is called, you might want to set conditions on when data is gathered. Alternatively, you might want to dig deeper into your own code than the built-in instruments allow. For these situations, Instruments lets you create custom instruments.
Custom instruments use DTrace for their implementation. DTrace is a dynamic tracing facility originally created by Sun and ported to Mac OS X v10.5. Because DTrace taps into the operating system kernel, you have access to low-level operation about the kernel itself and about the user processes running on your computer. Many of the built-in instruments are already based on DTrace. And even though DTrace is itself a very powerful and complex tool, Instruments provides a simple interface that gives you access to the power of DTrace without the complexity.
Important: Although the custom instrument builder simplifies the process of creating DTrace probes, you should still be familiar with DTrace and how it works before creating new instruments. Many of the more powerful debugging and data gathering actions require you to write DTrace scripts. To learn about DTrace and the D scripting language, see the Solaris Dynamic Tracing Guide, available from the OpenSolaris website. For information about the dtrace command-line tool, see dtrace man page.
Note: Several Apple applications—namely iTunes, DVD Player, and Front Row, and applications that use QuickTime—prevent the collection of data through DTrace (either temporarily or permanently) in order to protect sensitive data. Therefore, you should not run those applications when performing systemwide data collection.
The following sections show you how to create a custom instrument and how to use that instrument both with the Instruments application and the dtrace command-line tool.
In this section:
About Custom Instruments
Creating a Custom Instrument
Tips for Writing Custom Scripts
Exporting DTrace Scripts
About Custom Instruments
Custom instruments are built using DTrace probes. A probe is like a sensor that you place in your code. It corresponds to a location or event, such as a function entry point, to which DTrace can bind. When the function executes or the event is generated, the associated probe fires and DTrace runs whatever actions are associated with the probe. Most DTrace actions simply collect data about the operating system and user program behavior at that moment. It is possible, however, to run custom scripts as part of an action. Scripts let you use the features of DTrace to fine tune the data you gather.
Probes fire each time they are encountered, but the action associated with the probe need not be run every time the probe fires. A predicate is a conditional statement that lets you restrict when the probe’s action is run. For example, you can restrict a probe to a specific process or user, or you can run the action when a specific condition in your instrument is true. By default, probes do not have any predicates, meaning that the associated action runs every time the probe fires. You can add any number of predicates to a probe, however, and link them together using AND and OR operators to create complex decision trees.
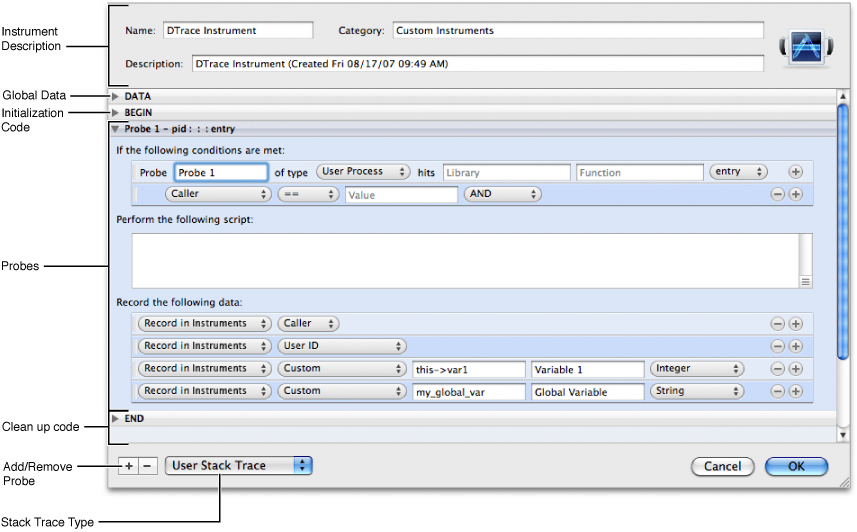
An instrument consists of the following blocks:
A description block, which contains the name, category, and description of the instrument
One or more probes, each containing its associated actions and predicates
A DATA declaration area, which you use to declare global variables shared by all probes
A BEGIN script, which initializes any global variables and performs any startup tasks required by the instrument
An END script, which performs any final clean up actions
All instruments must have at least one probe with its associated actions. Similarly, all instruments should have an appropriate name and description to identify them to Instruments users. Instruments displays your instrument’s descriptive information in the library window. Providing good information makes it easier to remember what the instrument does and how it should be used.
Probes are not required to have global data or begin and end scripts. Those elements are used in advanced instrument design when you want to share data among probes or provide some sort of initial configuration for your instrument. The creation of DATA, BEGIN, and END blocks is described in “Tips for Writing Custom Scripts.”
Creating a Custom Instrument
To create a custom DTrace instrument, select Instrument > Build New Instrument. (You can also choose Add Instrument > DTrace Instrument from the action menu of your trace document to perform the same action.) This command displays the instrument configuration sheet, which is shown in Figure 7-1. You use this sheet to specify your instrument information, including any probes and custom scripts.
At a minimum, you should provide the following information for every instrument you create:
Name. The name associated with your custom instrument in the library.
Category. The category in which your instrument appears in the library. You can specify the name of an existing category—such as Memory—or create your own.
Description. The instrument description and is used in both the library window and in the instrument’s help tag.
Probe provider. The probe type and the details of when it should fire. Typically, this involves specifying the method or function to which the probe applies. For more information, see “Specifying the Probe Provider”
Probe action. The data to record or the script to execute when your probe fires; see “Adding Actions to a Probe.”
An instrument should contain at least one probe and may contain more than one. The probe definition consists of the provider information, predicate information, and action. All probes must specify the provider information at a minimum, and nearly all probes define some sort of action. The predicate portion of a probe definition is optional but can be a very useful tool for focusing your instrument on the correct data.
Adding and Deleting Probes
Every new instrument comes with one probe that you can configure. To add more probes, click the plus (+) button at the bottom of the instrument configuration sheet.
To remove a probe from your instrument, click the probe to select it and press the minus (-) button.
When adding probes, it is a good idea to provide a descriptive name for the probe. By default, Instruments enumerates probes with names like “Probe 1” and “Probe 2”.
Specifying the Probe Provider
To specify the location point or event that triggers a probe, you must associate the appropriate provider with the probe. Providers are kernel modules that act as agents for DTrace, providing the instrumentation necessary to create probes. You do not need to know how providers operate to create an instrument, but you do need to know the basic capabilities of each provider. Table 7-1 lists the providers that are supported by the Instruments application and available for use in your custom instruments. The Provider column lists the name displayed in the instrument configuration sheet while the DTrace provider column lists the actual name of the provider used in the corresponding DTrace script.
Provider | DTrace provider | Description |
|---|---|---|
User Process |
| The probe fires on entry (or return) of the specified function in your code. You must provide the function name and the name of the library that contains it. |
Objective-C |
| The probe fires on entry (or return) of the specified Objective-C method. You must provide the method name and the class to which it belongs. |
System Call |
| The probe fires on entry (or return) of the specified system library function. |
DTrace |
| The probe fires when DTrace itself enters a BEGIN, END, or ERROR block. |
Kernel Function Boundaries |
| The probe fires on entry (or return) of the specified kernel function in your code. You must provide the kernel function name and the name of the library that contains it. |
Mach |
| The probe fires on entry (or return) of the specified Mach library function. |
Profile |
| The probe fires regularly at the specified time interval on each core of the machine. Profile probes can fire with a granularity that ranges from microseconds to days. |
Tick |
| The probe fires at periodic intervals on one core of the machine. Tick probes can fire with a granularity that ranges from microseconds to days. You might use this provider to perform periodic tasks that are not required to be on a particular core. |
I/O |
| The probe fires at the start of the specified kernel routine. For a list of functions monitored by this probe, use the |
Kernel Process |
| The probe fires on the initiation of one of several kernel-level routines. For a list of functions monitored by this probe, use the |
User-Level Synchronization |
| The probe fires at one of several synchronization points. You can use this provider to monitor mutex and read-write lock events. |
Core Data |
| The probe fires at one of several Core Data–specific events. For a list of methods monitored by this probe, use the |
Ruby |
| The probe fires at one of several Ruby-specific events. |
After selecting the provider for your probe, you need to specify the information needed by the probe. For function-level probes, this may require entering function or method name along with the code module or class containing it. Some providers may simply involve selecting the appropriate events from a pop-up menu.
After you have configured a probe, you can proceed to add additional predicates to it (to determine when it should fire) or you can go ahead and define the action for that probe.
Adding Predicates to a Probe
Predicates let you control when a probe’s action is executed by Instruments. You can use them to prevent Instruments from gathering data in situations you do not care about or that might provide erroneous information. For example, if your code exhibits unusual behavior only when the stack reaches a certain depth, you could use a predicate to specify the minimum target stack depth. Every time a probe fires, Instruments evaluates the associated predicates. Only if they evaluate to true does DTrace perform the associated actions.
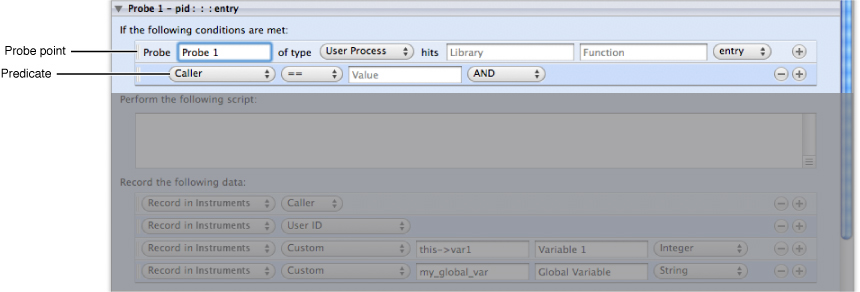
To add a predicate to a probe, click the plus (+) button at the end of the Probe line. Instruments adds a new predicate to the probe, as shown in Figure 7-2. You can add subsequent predicates using the plus (+) buttons of either the probe or the predicate. To remove a predicate, click the minus (-) button next to the predicate. To rearrange predicates, click the handle along the left side of the predicate line and drag it to a new location.
Instruments evaluates predicates from top to bottom in the order they appear. You can link predicates using the AND and OR operators but you cannot group them to create nested condition blocks. Instead, you must order your predicates carefully to ensure all of the appropriate conditions are checked.
The first pop-up menu in a predicate line lets you choose the data to inspect as part of the condition. Table 7-2 lists the standard variables defined by DTrace that you can use in your predicates or script code. The Variable column lists the name as it appears in the instrument configuration panel, while the DTrace variable column lists the actual name of the variable used in corresponding DTrace scripts. In addition to the standard variables, you can test against custom variables and constants from your script code by specifying the Custom variable type in the predicate field.
Variable | DTrace variable | Description |
|---|---|---|
Caller |
| The value of the current thread’s program counter just before entering the probe. This variable contains an integer value. |
Chip |
| The identifier for the physical chip executing the probe. This is a 0-based integer indicating the index of the current core. For example, a four core machine has cores 0 through 3. |
CPU |
| The identifier for the CPU executing the probe. This is a 0-based integer indicating the index of the current core. For example, a four core machine has cores 0 through 3. |
Current Working Directory |
| The current working directory of the current process. This variable contains a string value. |
Last Error # |
| The error value returned by the last system call made on the current thread. This variable contains an integer value. |
Executable |
| The name that was passed to |
User ID |
| The real user ID of the current process. This variable contains an integer value. |
Group ID |
| The real group ID of the current process. This variable contains an integer value. |
Process ID |
| The process ID of the current process. This variable contains an integer value. |
Parent ID |
| The process ID of the parent process. This variable contains an integer value. |
Thread ID |
| The thread ID of the current thread. This is the same value returned by the |
Interrupt Priority Level |
| The interrupt priority level on the current CPU at the time the probe fired. This variable contains an unsigned integer value. |
Function |
| The function name part of the probe’s description. This variable contains a string value. |
Module |
| The module name part of the probe’s description. This variable contains a string value. |
Name |
| The name portion of the probe’s description. This variable contains a string value. |
Provider |
| The provider name part of the probe’s description. This variable contains a string value. |
Root Directory |
| The root directory of the process. This variable contains a string value. |
Stack Depth |
| The stack frame depth of the current thread at the time the thread fired. This variable contains an unsigned integer value. |
Relative Timestamp |
| The current value of the system’s timestamp counter, measured in nanoseconds. Because this counter increments from an arbitrary point in the past, you should use it to calculate only relative time differences. This variable contains an unsigned 64-bit integer value. |
Virtual Timestamp |
| The amount of time the current thread has been running, measured in nanoseconds. This value does not include time spent in DTrace predicates and actions. This variable contains an unsigned 64-bit integer value. |
Timestamp |
| The current number of nanoseconds that have elapsed since 00:00 Universal coordinated Time, January 1, 1970. This variable contains an unsigned 64-bit integer value. |
|
| The first 10 arguments to the probe represented as raw 64-bit integers. If fewer than ten arguments were passed to the probe, the remaining variables contain the value 0. |
Custom | The name of your variable | Use this option to specify a variable or constant from one of your scripts. |
In addition to the condition variable, you must specify the comparison operator and the target value.
Adding Actions to a Probe
When a probe point defined by your instrument is hit, and the probe’s predicate conditions evaluate to true, DTrace runs the actions associated with the probe. You use your probe’s actions to gather data or to perform some additional processing. For example, if your probe monitors a specific function or method, you could have it return the caller of that function and any stack trace information to Instruments. If you wanted a slightly more advanced action, you could use a script variable to track the number of times the function was called and report that information as well. And if you wanted an even more advanced action, you could write a script that uses kernel-level DTrace functions to determine the status of a lock used by your function. In this latter case, your script code might also return the current owner of the lock (if there is one) to help you determine the interactions among your code’s different threads.
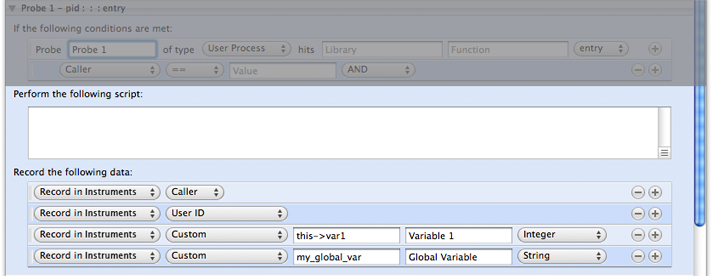
Figure 7-3 shows the portion of the instrument configuration sheet where you specify your probe’s actions. The script portion simply contains a text field for you to type in your script code. (Instruments does not validate your code before passing it to DTrace, so check your code carefully.) The bottom section contains controls for specifying the data you want DTrace to return to Instruments. You can use the pop-up menus to configure the built-in DTrace variables you want to return. You can also select Custom from this pop-up menu and return one of your script variables.
When you configure your instrument to return a custom variable, Instruments asks you to provide the following information:
The script variable containing the data
The name to apply to the variable in your instrument interface
The type of the variable
Any data your probe returns to Instruments is collected and displayed in your instrument’s Detail pane. The Detail pane displays all data variables regardless of type. If stack trace information is available for a specific probe, Instruments displays that information in your instrument’s Extended Detail pane. In addition, Instruments automatically looks for integer data types returned by your instrument and adds those types to the list of statistics your instrument can display in the track pane.
Because DTrace scripts run in kernel space and the Instruments application runs in user space, if you want to return the value of a custom pointer-based script variable to Instruments, you must create a buffer to hold the variable’s data. The simplest way to create a buffer is to use the copyin or copyinstr subroutines found in DTrace. The copyinstr subroutine takes a pointer to a C string and returns the contents of the string in a form you can return to Instruments. Similarly, the copyin subroutine takes a pointer and size value and returns a buffer to the data, which you can later format into a string using the stringof keyword. Both of these subroutines are part of the DTrace environment and can be used from any part of your probe’s action definition. For example, to return the string from a C-style string pointer, you would simply wrap the variable name with the copyinstr subroutine as shown in Figure 7-4.

Important: Instruments automatically wraps built-in variables (such as the arg0 through arg9 function arguments) with a call to copyinstr if the variable type is set to string. It does not do this with your script’s custom variables, however. You are responsible for ensuring that the data in a custom variable actually matches the type specified for that variable.
For a list of the built-in variables supported by Instruments, see Table 7-2. For more information on scripts and script variables, see “Tips for Writing Custom Scripts.” For more information on DTrace subroutines, including the copyin and copyinstr subroutines, see the Solaris Dynamic Tracing Guide available from the OpenSolaris website.
Tips for Writing Custom Scripts
You write DTrace scripts using the D scripting language, whose syntax is derived from a large subset of the C programming language. The D language combines the programming constructs of the C language with a special set of functions and variables to help you trace information in your program.
The following sections describe some of the common ways to use scripts in your custom instruments. These sections do not provide a comprehensive overview of the D language or the process for writing DTrace scripts, however. For information about scripting and the D language, see the Solaris Dynamic Tracing Guide, available on the OpenSolaris website.
Writing BEGIN and END Scripts
If you want to do more than return the information in DTrace’s built-in variables to Instruments whenever your action fires, you need to write custom scripts. Scripts interact directly with DTrace at the kernel level, providing access to low-level information about the kernel and the active process. Most instruments use scripts to gather information not readily available from DTrace. You can also use scripts to manipulate raw data before returning it to Instruments. For example, you could use a script to normalize a data value to a specific range if you wanted to make it easier to compare that value graphically with other values in your instrument’s track pane.
In Instruments, the custom instrument configuration sheet provides several areas where you can write DTrace scripts:
The DATA section contains definitions of any global variables you want to use in your instrument.
The BEGIN section contains any initialization code for your instrument.
Each probe contains script code as part of its action.
The END section contains any clean up code for your instrument.
All script sections are optional. You are not required to have initialization scripts or clean up scripts if your instrument does not need them. If your instrument defines global variables in its DATA section, however, it is recommended that you also provide an initialization script to set those variables to a known value. The D language does not allow you to assign values inline with your global variable declarations, so you must put those assignments in your BEGIN section. For example, a simple DATA section might consist of a single variable declaration, such as the following:
int myVariable; |
The corresponding BEGIN section would then contain the following code to initialize that variable:
myVariable = 0; |
If your corresponding probe actions change the value of myVariable, you might use the END section of your probe to format and print out the final value of the variable.
Most of your script code is likely to be associated with individual probes. Each probe can have a script associated with its action. When it comes time to execute a probe’s action, DTrace runs your script code first and then returns any requested data back to Instruments. Because passing data back to Instruments involves copying data from the kernel space back to the Instruments program space, you should always pass data back to Instruments by configuring the appropriate entries in the “Record the following data:“ section of the instrument configuration sheet. Variables returned manually from your script code may not be returned correctly to Instruments.
Accessing Kernel Data from Custom Scripts
Because DTrace scripts execute inside the system kernel, they have access to kernel symbols. If you want to look at global kernel variables and data structures from your custom instruments, you can do so in your DTrace scripts. To access a kernel variable, you must precede the name of the variable with a single back quote character (`). The back quote character tells DTrace to look for the specified variable outside of the current script.
Listing 7-1 shows a sample action script that retrieves the current load information from the avenrun kernel variable and uses that variable to calculate one-minute average load of the system. If you were to create a probe using the Profile provider, you could have this script gather load data periodically and then graph that information in Instruments.
Listing 7-1 Accessing kernel variables from a DTrace script
this->load1a = `avenrun[0]/1000; |
this->load1b = ((`avenrun[0] % 1000) * 100) / 1000; |
this->load1 = (100 * this->load1a) + this->load1b; |
Scoping Variables Appropriately
DTrace scripts have an essentially flat structure, due to a lack of flow control statements and the desire to keep probe execution time to a minimum. Variables in DTrace scripts, however, can be scoped to different levels depending on your need. Table 7-3 lists the scoping levels for variables and the syntax for using variables at each level.
Scope | Syntax example | Description |
|---|---|---|
Global |
| Global variables are identified simply using the variable name. All probe actions on all system threads have access to variables in this space. |
Thread |
| Thread-local variables are dereferenced from the |
Probe |
| Probe-local variables are dereferenced using the |
Finding Script Errors
If the script code for one of your custom instruments contains an error, Instruments displays an error message in the track pane when the script is compiled by DTrace. Instruments reports the error after you press the Record button in your trace document but before tracing actually begins. Inside the error message bubble is an Edit button. Clicking this button opens the instrument configuration sheet, which now identifies the probe with the error.
Exporting DTrace Scripts
Although Instruments provides a convenient interface for gathering trace data, there are still times when it is move convenient to gather trace data directly using DTrace. If you are a system administrator or are writing automated test scripts, for example, you might prefer to use the DTrace command-line interface to launch a process and gather the data. Using the command-line tool requires you to write your own DTrace scripts, however, which can be time consuming and can lead to errors. If you already have a trace document with one or more DTrace-based instruments, you can use the Instruments application to generate a DTrace script that provides the same behavior as the instruments in your trace document.
Instruments supports exporting DTrace scripts only for documents where all of the instruments are based on DTrace. This means that your document can include custom instruments and a handful of the built-in instruments, such as the instruments in the File System and CoreData groups in the Library window. Information about whether an instrument is DTrace-based is included with the instrument description in “Built-in Instruments.”
To export a DTrace script, select the trace document containing the instruments and choose File > DTrace Script Export. This command places the script commands for your instruments in a text file that you can then pass to the dtrace command-line tool using the -s option. For example, if you exported a script named MyInstrumentsScript.d, you would run it from Terminal using the following command:
sudo dtrace -s MyInstrumentsScript.d |
Note: You must have superuser privileges to run dtrace in most instances, which is why the sudo command is used to run dtrace in the preceding example.
Another advantage of exporting your scripts from Instruments (as opposed to writing it manually) is that after running the script, you can import the resulting data back into Instruments and review it there. Scripts exported from Instruments print a start marker (with the text <dtrace_output_begin>) at the beginning of the dtrace output. To gather the data, simply copy all of the DTrace output (including the start marker) from Terminal and paste it into a text file, or just redirect the output from the dtrace tool directly to a file. To import the data in Instruments, select the trace document from which you generated the original script and choose File > DTrace Data Import.
© 2008 Apple Inc. All Rights Reserved. (Last updated: 2008-10-15)