Miscellaneous Topics
In this section:
Code Analysis with the G5 (PPC970) Model
Supervisor Space Sampling Guidelines
Code Analysis with the G5 (PPC970) Model
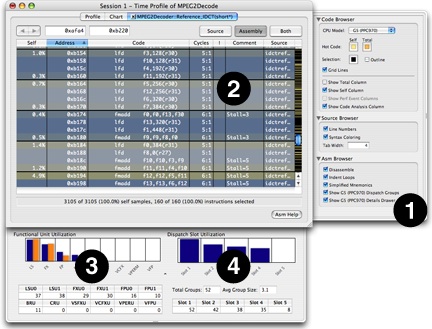
Shark offers several features designed to help the programmer understand instruction execution behavior on the G5 (PPC970). From the Advanced Settings drawer’s Assembly Browser tab, you can set the Assembly Browser to display an estimate of G5 dispatch group formations, using the check box near item #1 in Figure B-1. After this is checked, the assembly display around item #2 has dark lines added to indicate breaks between instruction dispatch groups. If you look closely, you will see that all of Shark’s samples generally fall on the first or last instructions of dispatch groups, due to the way program counters are captured by Shark on the G5 processor. A key factor in optimizing performance on the G5 is maximizing dispatch group sizes. A detailed explanation of G5 dispatch group formation rules is beyond the scope of this document, but Shark accurately models the CPU behavior as much as possible using static analysis. See the PowerPC970 User Manual (see the PowerPC 970 documentation) for a complete description of dispatch groups.
Functional unit utilization and dispatch slot utilization are two more features that Shark offers to visualize G5 execution behavior. When the user selects Show G5 (PPC970) Details Drawer in the Advanced Settings drawer (at #1 in Figure B-1), the user will see the G5 Resource Utilization drawer. The Functional Unit Utilization chart and table (item #3) provide visual feedback to the programmer about how effectively instructions are spread among the various functional units within the G5. Similarly, the number of dispatch groups and instructions flowing into each G5 dispatch slot are shown in the Dispatch Slot Utilization chart and table (item #4). Please note that the data in the G5 Resource Utilization drawer is based on the currently selected instructions in the Code Table, or on the entire code sequence if nothing is selected. The user can specify a subset of instructions within the current Code Table, and the G5 Resource Utilization charts and tables will update dynamically.
Supervisor Space Sampling Guidelines
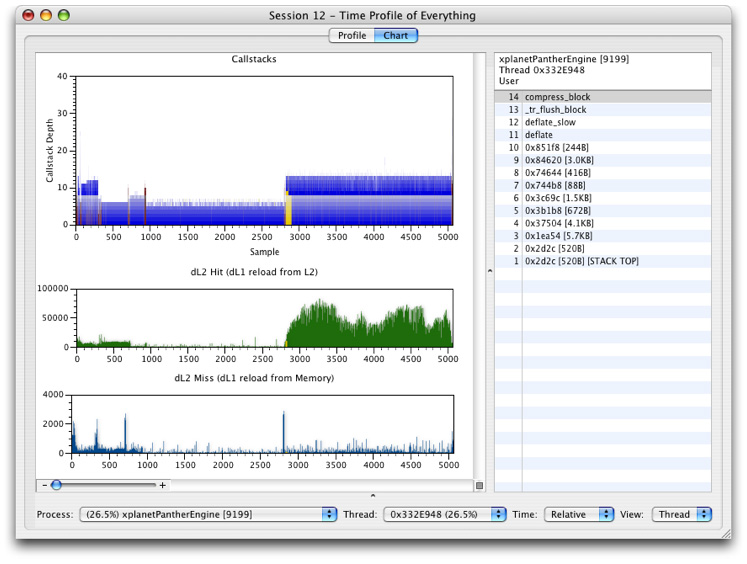
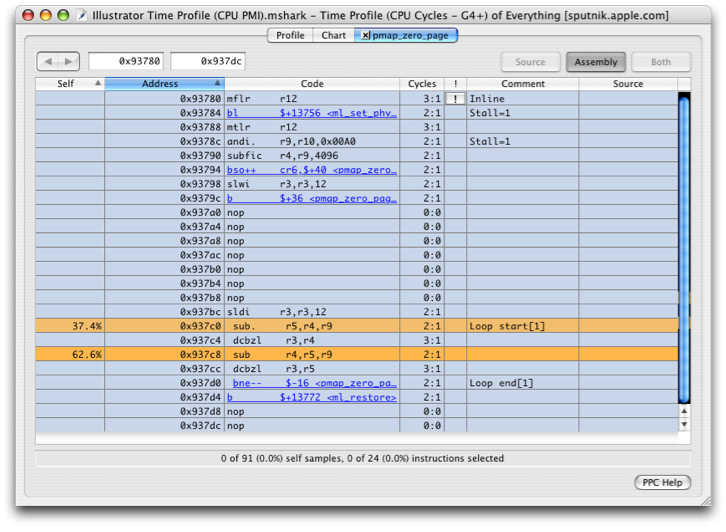
Supervisor space samples come from either the Mach kernel or kernel extensions. If you are a driver writer or simply interested in the workings of the Mac OS X kernel, you may encounter inconsistent results between timer sampling and event sampling when profiling code that executes with interrupts disabled. For example, consider the PowerPC-specific virtual memory (VM) page-zeroing code in the kernel. When profiled with timer sampling, Shark displays the output shown in Figure B-2. Because pmap_zero_page() disables interrupts, any timer interrupts that occur in it are not serviced until interrupts are reenabled in ml_restore(). It is for this reason that all of the timer samples appear to come from the isync instruction at 0x96da8 (see Figure B-2).
A more accurate picture of the kernel behavior can be seen with event sampling (Figure B-3). This is because CPU event sampling reads the SIAR (sampled instruction address register) rather than the originating PC when the performance monitor interrupt is serviced. Whenever a CPU performance monitor interrupt (PMI) occurs, the SIAR register is set to the currently executing PC (program counter) . As in the timer sampling case, the PMI is not actually serviced until interrupts are reenabled.
© 2008 Apple Inc. All Rights Reserved. (Last updated: 2008-04-14)


