Mac OS X Developer Tools
Apple provides a number of applications and command-line tools to help you develop your software. These tools include compilers, debuggers, performance analysis tools, visual design tools, scripting tools, version control tools, and many others. Many of these tools are installed with Mac OS X by default but the rest require you to install Xcode first. Xcode is available for free from the Apple Developer Connection website. For more information on how to get these tools, see “Getting the Xcode Tools.”
Note: Documentation for most of the command-line tools is available in the form of man pages. You can access these pages from the command line or from Mac OS X Man Pages. For more information about using the command-line tools, see “Command Line Primer.”
In this section:
Applications
Command-Line Tools
Applications
Xcode includes numerous applications for writing code, creating resources, tuning your application, and delivering it to customers. At the heart of this group is the Xcode application, which most developers use on a daily basis. It provides the basic project and code management facilities used to create most types of software on Mac OS X. All of the tools are free and can be downloaded from the Apple developer website (see “Getting the Xcode Tools”).
In Mac OS X v10.5 and later, it is possible to install multiple versions of Xcode on a single computer and run the applications and tools from different versions side-by-side. The applications listed in the following sections are installed in <Xcode>/Applications, where <Xcode> is the root directory of your Xcode installation. The default installation directory for Xcode is the /Developer directory.
In addition to the applications listed here, Xcode also comes with numerous command-line tools. These tools include the GCC compiler GDB debugger, tuning tools, code management tools, performance tools, and so on. For more information about the available command-line tools, see “Command-Line Tools.”
Xcode
The centerpiece of the Xcode Tools is the Xcode application, which is an integrated developer environment (IDE) with the following features:
A code editing environment that includes features such as syntax coloring, code completion, and symbol indexing; see“Xcode Editor”
Visual design tools for creating your application’s data model (see “Core Data Framework”)
An advanced documentation viewer for viewing and searching Apple documentation; see “Documentation Window”
A context-sensitive inspector for viewing information about selected code symbols; see “Research Assistant”
An advanced build system with dependency checking and build rule evaluation.
GCC compilers supporting C, C++, Objective-C, Objective-C++, Objective-C 2.0, and other compilers supporting Java and other languages
Integrated source-level debugging using GDB; see “Debugging Environment”
Distributed computing, enabling you to distribute large projects over several networked machines
Predictive compilation that speeds single-file compile turnaround times
Advanced debugging features such as fix and continue and custom data formatters
Advanced refactoring tools that let you make global modifications to your code without changing its overall behavior; see “Refactoring Tools”
Support for project snapshots, which provide a lightweight form of local source code management; see “Project Snapshots”
Support for launching performance tools to analyze your software
Support for integrated source-code management; see “SCM Repository Management”
AppleScript support for automating the build process
Support for the ANT build system, which can be used to build Java and WebObjects projects.
Support for DWARF and Stabs debugging information (DWARF debugging information is generated by default for all new projects)
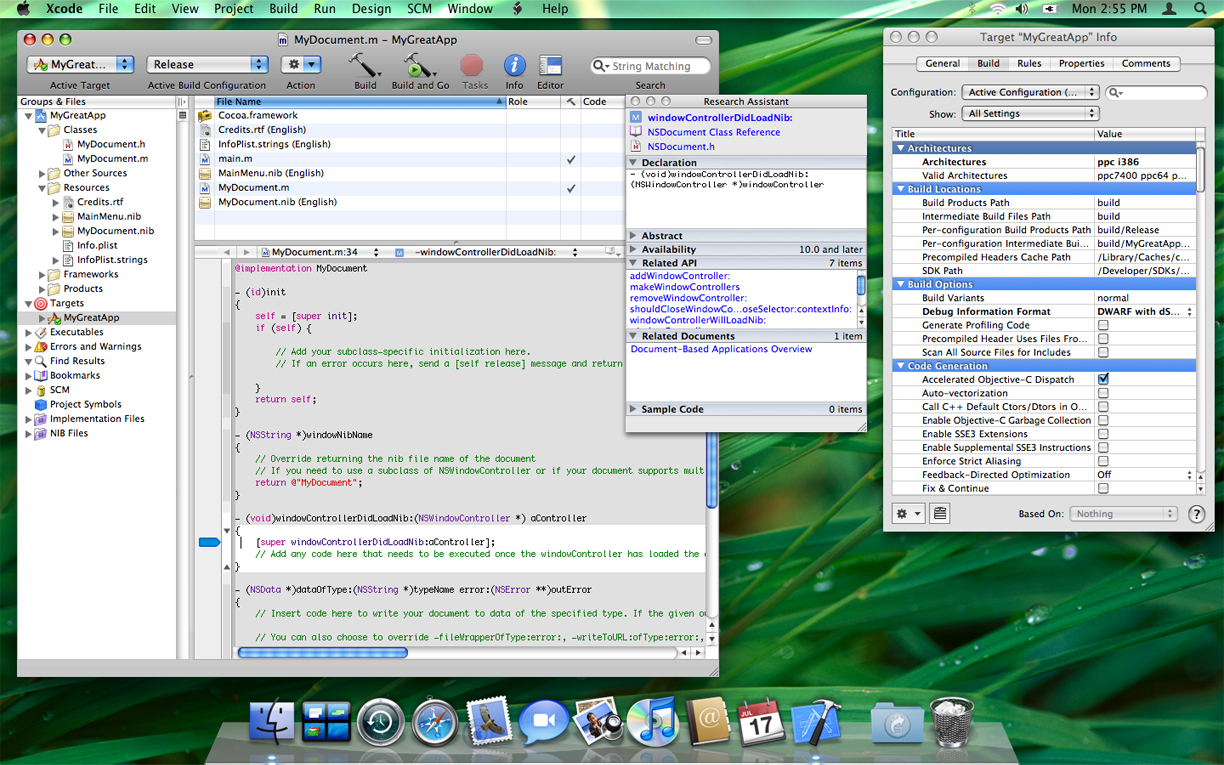
Figure C-1 shows the Xcode project workspace and some key inspector windows. In the Xcode preferences, you can configure numerous aspects of the workspace to suit your preferred work style.
For information on how to use Xcode, see Xcode User Guide.
Xcode Editor
The Xcode editing environment is a high-performance code editor that includes many features that go beyond basic text editing. These features aim to help developers create better code faster and include the following:
High-performance for typing, scrolling, and opening files. The Xcode editor now opens and scrolls large source documents up to 10 times faster than before.
Code annotations display notes, errors, and warnings inline with the code itself, and not just as icons in the gutter. This provides a much more direct conveyance of where the problems in your code lie. You can control the visibility of annotations using the segmented control in the navigation bar.
Code folding helps you organize your source files by letting you temporarily hide the content of a method or function in the editor window. You can initiate code folding by holding down the Command and Option keys and pressing either the left or right arrow key. A ribbon to the left of the text shows the current nesting depth and contains widgets to fold and unfold code blocks.
Syntax coloring lets you assign colors to various code elements, including keywords, comments, variables, strings, class names, and more.
Code Sense code completion, a feature that shows you type a few characters and retrieve a list of valid symbol names that match those characters. Code Sense is fast and intuitive and is tuned to provide accurate completions, along with a “most likely” inline completion as you type. This feature is similar to the auto-completion features found in Mail, Terminal, and other applications.
Debugging Environment
In Xcode 3.0, there is no distinction between “Running” your executable and “Debugging” it. Instead, you simply build your executable and run it. Hitting a breakpoint interrupts the program and displays the breakpoint either in the current editor window or in the debugger window. Other features of the debugging environment include the following:
Debugging controls in editor windows.
A debugger HUD (heads-up-display), which is a floating window with debugger controls that simplifies the debugging of full-screen applications.
Variable tooltips. (Moving your mouse over any variable displays that variable’s value.)
Reorganization (and in some cases consolidation) of toolbar and menu items to improve space usage, while still keeping all the needed tools available.
Consolidation of the Standard I/O Log, Run Log, and Console log into the Console log window.
Support for a separate debugging window if you prefer to debug your code that way.
Research Assistant
The Research Assistant is an inspector that displays documentation for the currently selected text (see Figure C-1). As the selection changes, the Research Assistant updates the information in its floating window to reflect the classes, methods, and functions you are currently using. This window shows the declaration, abstract, and availability information for the selection along with the framework containing the selected identifier, relevant documentation resources, and related methods and functions you might be interested in using.
Documentation Window
The documentation window (Figure C-2) in Xcode provides an environment for searching and browsing the documentation. This window provides you with fast access to Apple’s developer documentation and gives you tools for searching its content. You can search by title, by language, and by content and can focus your search on the documents in a particular documentation set.
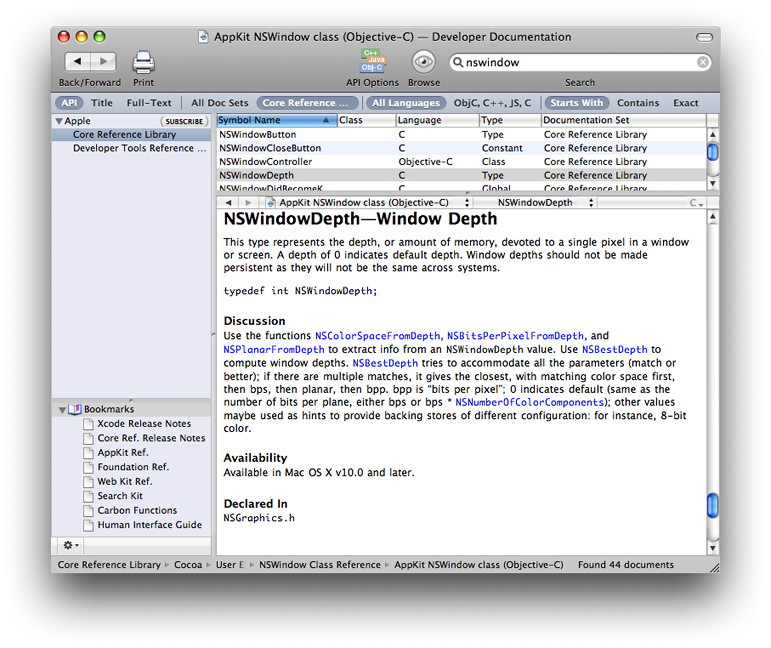
Documentation sets are collections of documents that can be installed, browsed, and searched independently. Documentation sets make it easier to install only the documentation you need for your development, reducing the amount of disk space needed for your developer tools installation. In addition to the Apple-provided documentation sets, third parties can implement their own documentation sets and have them appear in the Xcode documentation window. For information on how to create custom documentation sets, see Documentation Set Guide.
SCM Repository Management
Xcode supports the management of multiple SCM repositories to allow you to perform tasks such as the following:
Initial checkout of projects
Tagging source files
Branching
Importing and exporting files
Xcode supports CVS, Subversion, and Perforce repositories.
Project Snapshots
Project snapshots provide a lightweight form of local source control for Xcode projects. Using this feature, you can take a “snapshot” of your project’s state at any point during development, such as after a successful build or immediately prior to refactoring your code. If after making subsequent changes you decide those changes were not useful, you can revert your project files back to the previous snapshot state. Because snapshots are local, your intermediate changes need never be committed to source control.
Refactoring Tools
Xcode’s refactoring tools let you make large-scale changes to your Objective-C source code quickly and easily. Xcode propagates your change requests throughout your code base, making sure that the changes do not break your builds. You can make the following types of changes using the refactoring tools:
Rename instance methods
Create new superclasses
Move methods into a superclass
Convert accessor methods to support Objective-C 2.0 properties
Modernize appropriate
forloops to use the new fast enumeration syntax introduced in Objective-C 2.0
Before making any changes to your code, Xcode’s refactoring tools automatically take a local snapshot of your project. This automatic snapshot means you can experiment with refactoring changes without worrying about irrevocably changing your project files. For more information on snapshots, see “Project Snapshots.”
Build Settings
The Build pane in the inspector organizes the build settings for the selected target, providing search tools to help you find particular settings. In Mac OS X v10.5, some particularly noteworthy additions to this pane include the following:
Per-architecture build settings. You can now set different build settings for each architecture (Intel, PowerPC) your product supports.
32-bit and 64-bit architecture checkboxes.
Project Versioning
Xcode projects include a Compatibility pane in the project inspector that lets you determine whether you want an Xcode 3.0–only project or one that can be used by previous versions of Xcode. Marking a project as Xcode 3.0–only generates an alert whenever you try to use an Xcode feature that is not present in previous versions of the application.
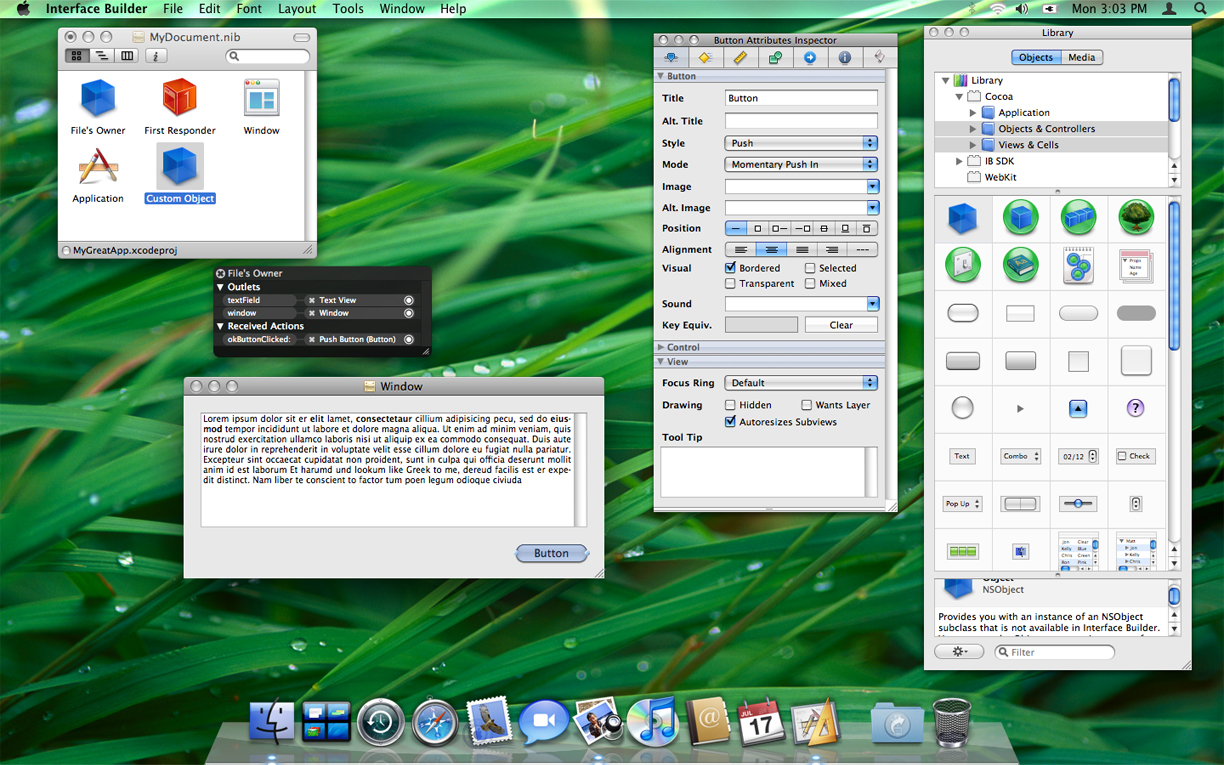
Interface Builder
The Interface Builder application provides a graphical environment for building the user interface of your Carbon and Cocoa applications. Using Interface Builder, you assemble the windows and menus of your application, along with the any other supporting objects, and save them in one or more resource files, called nib files. When you want to load a user interface element at runtime, you load the nib file. The Cocoa and Carbon infrastructure uses the data in the nib file to recreate the objects exactly as they were in Interface Builder, with all their attributes and inter-object relationships restored.
Although present in all versions of Mac OS X, the Interface Builder application received a significant overhaul in Mac OS X v10.5. Beyond the numerous cosmetic changes, the current version of Interface Builder includes numerous workflow and infrastructure changes too. The connections panel replaces the old technique for connecting objects in Cocoa nib files, making it possible to create multiple connections quickly without going back and forth between the inspector and the objects in your nib file. An improved library window helps you organize and find the components you use most frequently. Interface Builder includes a new plug-in model that makes it possible to create fully functional plug-ins in a matter of minutes. And most importantly, Interface Builder is more tightly integrated with Xcode, providing automatic synchronization of project’s class information with the corresponding source files.
Figure C-3 shows the Interface Builder environment in Mac OS X v10.5, including a nib document, connections panel, inspector window, and library window. The library window contains the standard components you use to build your user interfaces and includes all of the standard controls found in Carbon and Cocoa applications by default. Using plug-ins, you can expand the library to include your own custom objects or to include custom configurations of standard controls.
For information about Interface Builder features and how to use them, see Interface Builder User Guide. For information about how to integrate your own custom controls into Interface Builder, see Interface Builder Plug-In Programming Guide and Interface Builder Kit Framework Reference.
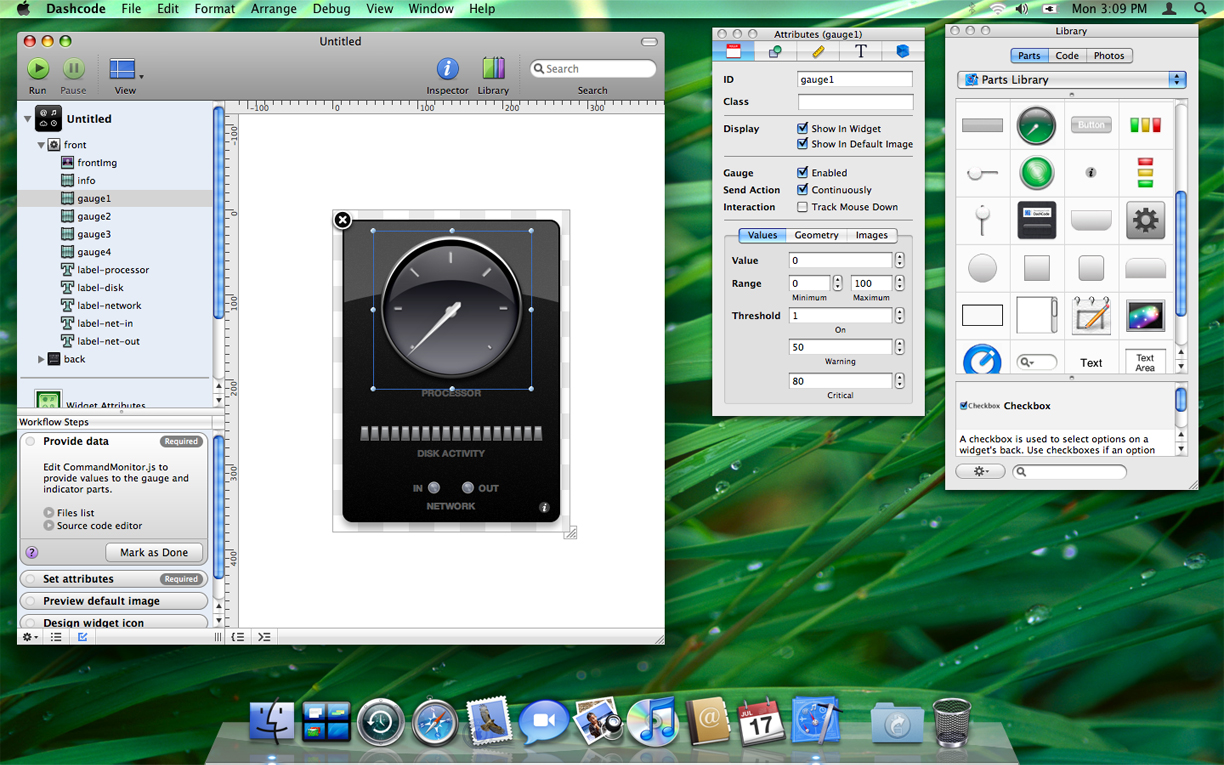
Dashcode
Introduced in Mac OS X v10.5, Dashcode is an integrated environment for laying out, coding, and testing Dashboard widgets. Although users see and use widgets as applications, they’re actually packaged webpages powered by standard technologies such as HTML, CSS, and JavaScript. Although it is easy for anyone with web design experience to build a widget using existing webpage editors, as a widget’s code and layout get more complex, managing and testing of that widget becomes increasingly difficult. Dashcode provides the following features to help simplify the widget design process:
A project manager to marshall your widget’s resources
Visual tools to design your widget interface
Tools to set metadata values, specify required images, and package your widget
A source code editor to implement your widget’s behavior
A debugger to help you resolve issues in your widget’s implementation
Figure C-4 shows the Dashcode canvas, inspector, and library windows. The canvas is a drag-and-drop layout environment where you lay out widgets visually. Using the inspector window, you can apply style information to the controls, text, and shape elements that you drag in from the library.
For more information about Dashcode, see Dashcode User Guide.
Instruments
Introduced in Mac OS X v10.5, Instruments is an advanced debugging and performance analysis application. Instruments provides unprecedented information about the runtime behavior of your application and complements existing tools such as Shark. Rather than show one aspect of your program at a time, you configure each analysis session with one or more “instruments”, each of which gathers information about things such as object allocation patterns, memory usage, disk I/O, CPU usage, and many more. The data from all instruments is shown side-by-side, making it easier to see patterns between different types of information.
An important aspect of Instruments is the repeatability of data gathering operations. Instruments lets you record a sequence of events in your application and store them in the master track. You can then replay that sequence to reproduce the exact same conditions in your application. This repeatability means that each new set of data you gather can be compared directly to any old sets, resulting in a more meaningful comparison of performance data. It also means that you can automate much of the data gathering operation. Because events are shown alongside data results, it is easier to correlate performance problems with the events that caused them.
Figure C-5 shows the Instruments user interface for an existing session. Data for each instrument is displayed along the horizontal axis. Clicking in those data sets shows you information about the state of the application at that point in time.
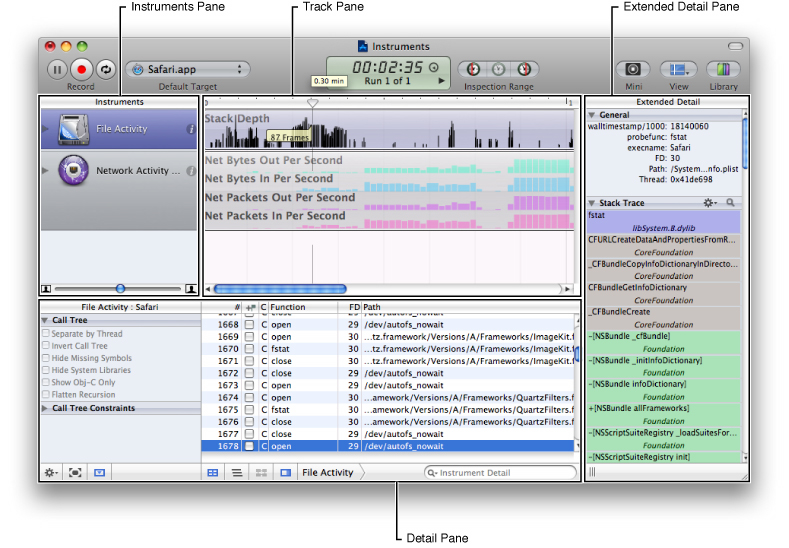
For information about how to use Instruments, see Instruments User Guide.
Quartz Composer
Introduced in Mac OS X version 10.4, Quartz Composer is a development tool for processing and rendering graphical data. Quartz Composer provides a visual development environment (Figure C-6) built on technologies such as Quartz 2D, Core Image, OpenGL, and QuickTime. You can use Quartz Composer as an exploratory tool to learn the tasks common to each visual technology without having to learn its application programming interface (API). You can also save your compositions as resource files that can be loaded into a Cocoa window at runtime. In addition to supporting visual technologies, Quartz Composer also supports nongraphical technologies such as MIDI System Services and Rich Site Summary (RSS) file content.
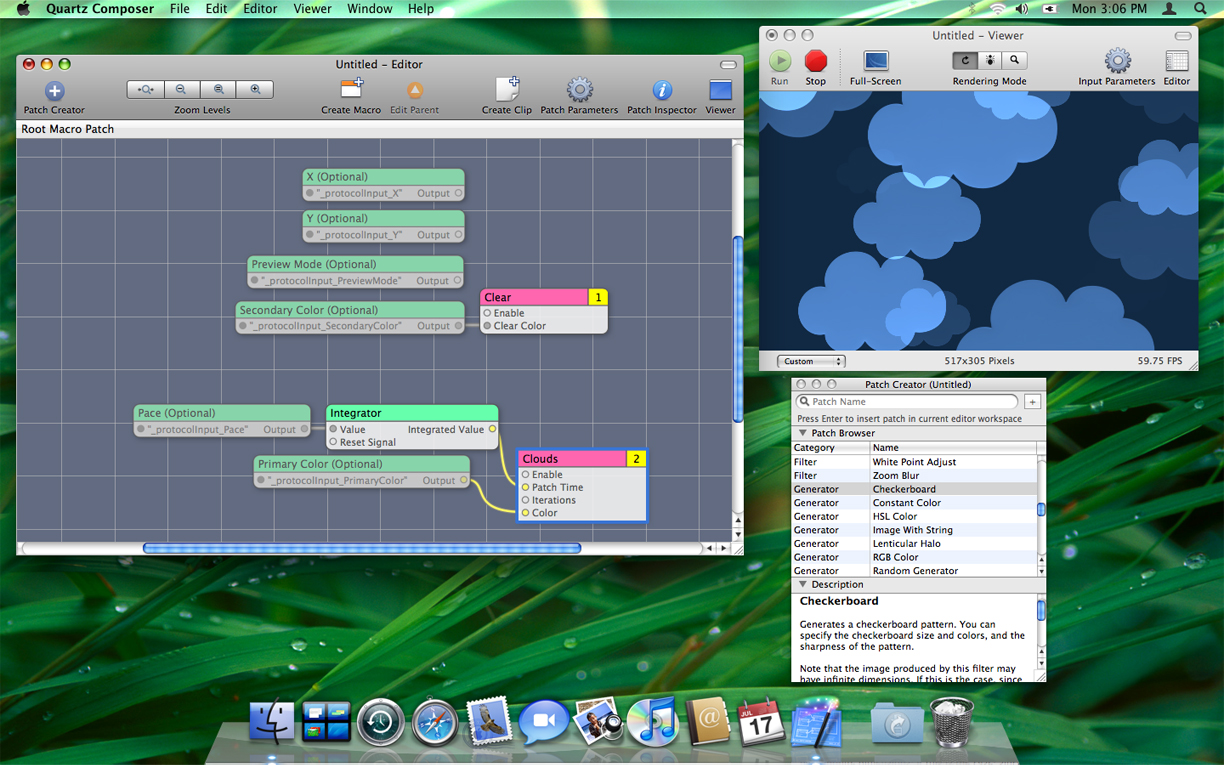
For information on how to use Quartz composer, see Quartz Composer User Guide.
AppleScript Studio
You can use AppleScript Studio to create AppleScript applications with complex user interfaces that support the Aqua human interface guidelines. AppleScript Studio is a combination of technologies, including AppleScript, Cocoa, the Xcode application, and Interface Builder.
For more information about AppleScript Studio, see AppleScript Studio Programming Guide or AppleScript Studio Terminology Reference.
Audio Applications
The <Xcode>/Applications/Audio directory contains applications for Core Audio developers.
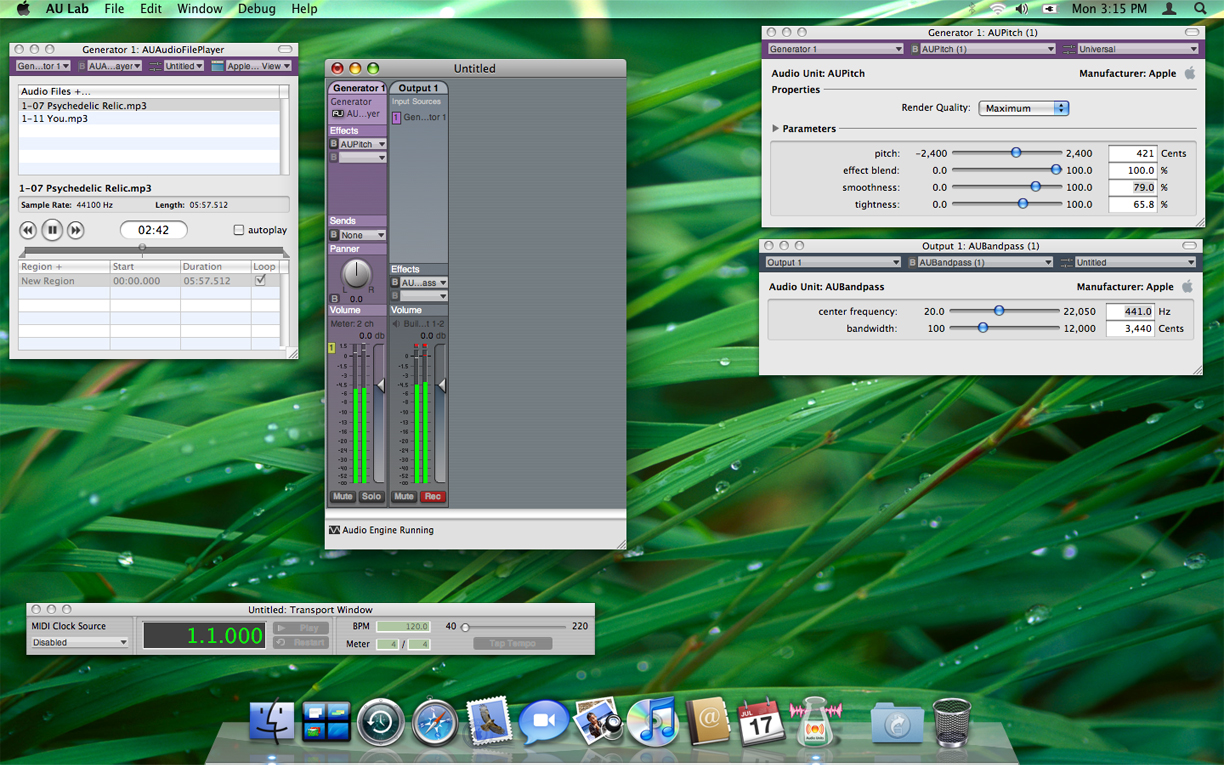
AU Lab
Introduced in Mac OS X version 10.4, AU Lab (Audio Unit Lab) lets you graphically host audio units and examine the results. You can use AU Lab to test the audio units you develop, do live mixing, and playback audio content. Parameters for the audio units are controlled graphically using the audio unit’s custom interface or using a generic interface derived from the audio unit definition. Figure C-7 shows the AU Lab interface and some of the palettes for adjusting the audio parameters.
HALLab
Introduced in Mac OS X version 10.5, the HALLab (Hardware Abstraction Layer Lab) application helps developers test and debug audio hardware and drivers. You can use this application to understand what the audio hardware is doing and to correlate the behavior of your application with the behavior of the underlying audio driver. The application provides information about the properties of objects in the HAL and provides an I/O cycle telemetry viewer for diagnosing and debugging glitches your application’s audio content.
Graphics Applications
Table C-1 lists the applications found in the <Xcode>/Applications/Graphics Tools directory.
Application | Description |
|---|---|
Introduced in Mac OS X v10.5, this application provides an environment for testing the effects of Core Image filters. Using this application, you can build up a set of filters and apply them to an image or set of images. You can apply both static and time-based effects and change the parameters of each filter dynamically to see the results. | |
An application that displays extensive information about the OpenGL environment. | |
An application that creates a runtime profile of an OpenGL-based application. The profile contains OpenGL function-call timing information, a listing of all the OpenGL function calls your application made, and all the OpenGL-related data needed to replay your profiling session. | |
An application that provides real-time entry, syntax checking, debugging, and analysis of vertex/fragment programs. It allows you to export your creation to a sample GLUT application, which performs all the necessary OpenGL setup, giving you a foundation to continue your application development. OpenGL is an open, cross-platform, three-dimensional (3D) graphics standard that supports the abstraction of current and future hardware accelerators. For more information about OpenGL, see OpenGL Programming Guide for Mac OS X in the Reference Library > Graphics & Imaging area. | |
A magnifying glass utility for Mac OS X. Pixie is useful for doing pixel-perfect layout, checking the correctness of graphics and user interface elements, and getting magnified screen shots. | |
A utility for previewing Quartz Composer compositions. | |
This is an alias to the Quartz Debug application in the <Xcode> |
Java
Table C-2 lists the applications found in the <Xcode>/Applications/Java Tools directory.
Application | Description |
|---|---|
An application that acts as a wrapper for running Java applets. | |
An application that allows you to package your Java program’s files and resources into a single double-clickable application bundle. Jar Bundler lets you modify certain properties so your Java application behaves as a better Mac OS X citizen and lets you specify arguments sent to the Java virtual machine (VM) when the application starts up. |
Performance Applications
Table C-3 lists the applications found in the <Xcode>/Applications/Performance Tools directory.
Application | Description |
|---|---|
An application that presents statistics about the current system activity and lets you track those statistics over time. This application is a more visually oriented version of the top command-line tool. It provides information about CPU usage, disk and network throughput, memory usage, and others. For information on how to use this program, see the application help. | |
An application for measuring the dynamic memory usage of applications and for finding memory leaks. For information on how to use this program, see the application help or Memory Usage Performance Guidelines. | |
A debugging utility for the Quartz graphics system. For information on how to use this program, see the application help or Drawing Performance Guidelines. | |
An application that profiles the system to see how time is being spent. It can work at the system, task, or thread level and can correlate performance counter events with source code. Shark’s histogram view can be used to observe scheduling and other time-dependent behavior. It can produce profiles of hardware and software performance events such as cache misses, virtual memory activity, instruction dependency stalls, and so forth. For information on how to use this program, see the application help. | |
An application that samples applications automatically whenever they become unresponsive and display the spinning cursor. To use this application, you launch it and leave it running. Spin Control provides basic backtrace information while an application is unresponsive, showing you what the application was doing at the time. | |
An application for graphically displaying activity across a range of threads. It provides timeline color-coded views of activity on each thread. By clicking a point on a timeline, you can see a sample backtrace of activity at that time. | |
An application for analyzing memory usage. |
Table C-4 lists the applications in the <Xcode>/Applications/Performance Tools/CHUD directory and its subdirectories.
Application | Description |
|---|---|
An application that examines and modifies CPU and PCI configuration registers in PowerPC processors. | |
An application for finding performance counter events and their configuration. | |
An application that is an exact, function-level profiler for your application. Unlike sampling programs, which gather call stacks at periodic intervals, you can use this application to generate and view a complete function call trace of your application code. | |
An application that monitors the power state of hard drives connected to the computer. |
Utility Applications
Table C-5 lists the applications found in the <Xcode>/Applications/Graphics Tools directory and its subdirectories.
Application | Description |
|---|---|
An agent application that lets you roll the mouse cursor over items in your application’s user interface and view their associated accessibility attributes and actions. | |
An application that looks for mistakes in the accessibility information provided by your application. | |
An application for discovering and getting information about Bluetooth devices. | |
An application for creating applets from Python scripts. | |
An application that displays the contents of the various system pasteboards. | |
An application for configuring the user notifications generated when an application crashes. | |
An application that compares two ASCII files or two directories. For a more accurate comparison, you can compare two files or directories to a common ancestor. After comparing, you can merge the files or directories. | |
An application to create a search index for a help file. Instructions for creating Apple Help and for using the indexing tool are in Apple Help Programming Guide. | |
An application for creating and examining icon resource files. | |
An application that you can use to examine the configuration of devices on your computer. IORegistryExplorer provides a graphical representation of the I/O Registry tree. For information on how to use this application, see I/O Kit Fundamentals. | |
iSync Plug-in Maker | This application creates device drivers that allow the synchronization of custom hardware devices. For more information, see “iSync Plug-in Maker.” |
PackageMaker | An application for creating installable application packages from the set of files you provide. |
An application for logging Bluetooth packets. | |
An application that lets you read and edit the contents of a property list. A property list, or plist, is a data representation used by Cocoa and Core Foundation as a convenient way to store, organize, and access standard object types. Property lists are useful when you need to store small amounts of persistent data. If you do use property lists, the | |
An application designed to improve the pronunciation of text generated by the Text-To-Speech system. | |
An application for building language models for use with the Speech Recognition manager. | |
A debugging application you use to inspect the truth database, the call history of sync sessions, and clients of the synchronization engine. For information on how to use this application, see Sync Services Tutorial. | |
An application that displays detailed information about all the USB ports and devices on the system. |
iSync Plug-in Maker
The iSync Plug-in Maker application is a tool that allows you to build, test, and release plug-ins that handle the specific features supported by your hardware device. You use this application to configure your device settings and write scripts for connecting it to the Internet. The application also provides a suite of standard automated tests that you can use to detect and fix problems in your plug-in before you ship it.
Figure C-8 shows the iSync Plug-in Maker edit window.
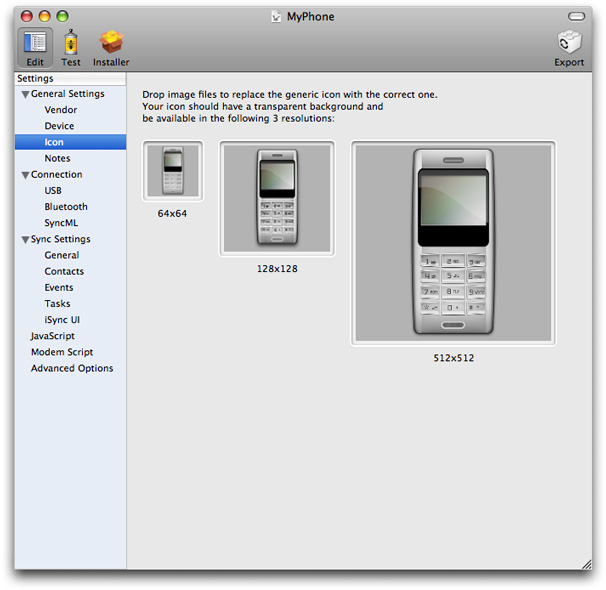
For information about using iSync Plug-in Maker, see iSync Plug-in Maker User Guide.
PackageMaker
You use PackageMaker to create installation packages for your software. An installation package is a convenient way to deliver software in all but the simplest cases. An installation package contains the files to install, their locations, and any licensing information or supporting materials that go with your software. When the user double-clicks an installation package, Mac OS X automatically launches the Installer application, which proceeds to install the files contained in the package.
You can use PackageMaker to package files or to assemble individual packages into a single package. Figure C-9 shows the PackageMaker user interface, which provides a graphical environment for building your packages.
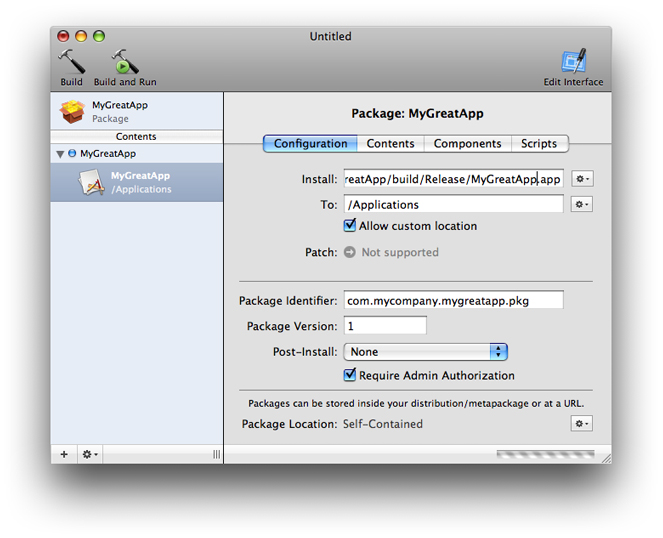
For information on how to use PackageMaker, see PackageMaker User Guide.
Command-Line Tools
Xcode includes numerous command-line tools, including the GCC compiler, GDB debugger, performance tools, version control system tools, localization tools, scripting tools, and so on. Some of these tools are found on most other BSD-based installations while others were created specifically for Mac OS X. They come free with the rest of Xcode, which you can download from the Apple developer website (see “Getting the Xcode Tools”).
In Mac OS X v10.5 and later, it is possible to install multiple versions of Xcode on a single computer and run the applications and tools from different versions side-by-side. Most of the tools listed in the following sections are installed in either in the system’s /usr/bin directory or in <Xcode>/usr/bin or <Xcode>/usr/sbin, where <Xcode> is the root directory of your Xcode installation, although tools installed elsewhere are called out as such. The default installation directory for Xcode is the /Developer directory.
In addition to the command-line tools listed here, Xcode also comes with many higher-level applications. These tools include the Xcode integrated development environment, Interface Builder, Instruments, and many others. For more information about the available applications, see “Applications.”
Note: The following sections describe some of the more important tools provided with Xcode but should by no means be considered a complete list. If the tool you are looking for is not described here, check the system and Xcode tools directories or see Mac OS X Man Pages.
Compiler, Linker, and Source Code Tools
Apple provides several applications and command-line tools for creating source code files.
Compilers, Linkers, Build Tools
Table C-6 lists the command-line compilers, linkers, and build tools. These tools are located in <Xcode>/usr/bin and <Xcode>/Private.
Tool | Description |
|---|---|
The Mac OS X Mach-O assembler. See | |
The BSD make program. See | |
The command-line interface to the GNU C compiler (GCC). Normally you invoke GCC through the Xcode application; however, you can execute it from a command line if you prefer. See | |
The GNU make program. See | |
An open-source build system initially released by Perforce, which provides the back-end for the Xcode application’s build system. It is rarely used directly from the command line. Documented on the Perforce website athttp://www.perforce.com/jam/jam.html. | |
Combines several Mach-O (Mach object) files into one by combining like sections in like segments from all the object files, resolving external references, and searching libraries. Mach-O is the native executable format in Mac OS X. See | |
A symbolic link to | |
Constructs a set of include file dependencies. You can use this command in a make file if you are constructing make files instead of using Xcode to build and compile your program. See | |
Takes an Xcode project ( | |
Builds a target contained in an Xcode project. This command is useful if you need to build a project on another computer that you can connect to with Telnet. The |
Library Utilities
Table C-7 lists the command-line tools available for creating libraries. These tools are located in <Xcode>/usr/bin.
Tool | Description |
|---|---|
Takes object files and creates dynamically linked libraries or archive (statically linked) libraries, according to the options selected. The | |
Determines interdependencies in a list of object files. The output is normally used to determine the optimum ordering of the object modules when a library is created so that all references can be resolved in a single pass of the loader. See | |
Adds to or updates the table of contents of an archive library. See | |
Updates the prebinding of an executable or dynamic library when one of the dependent dynamic libraries changes. (Prebinding for user applications is unnecessary in Mac OS X v10.3.4 and later.) See | |
Updates prebinding information for libraries and executables when new files are added to the system. (Prebinding for user applications is unnecessary in Mac OS X v10.3.4 and later.) See |
Code Utilities
Table C-8 lists applications and command-line tools for manipulating source code and application resources. These tools are located in <Xcode>/usr/bin and /usr/bin.
Tool | Description |
|---|---|
Reformats a Fortran file for printing by the UNIX line printer. See | |
Takes a Fortran multiple-routine source-code file and splits it into multiple files, one for each routine. See | |
Scans C source files and writes out a sorted list of all the identifiers that appear in | |
Formats C source code. See | |
Changes global symbols in object code to static symbols. You can provide an input file that specifies which global symbols should remain global. The resulting object can still be used with the debugger. See | |
Can check the syntax of a property list or convert it from one format to another (XML or binary). See | |
Formats and prints character strings and C constants. See | |
Merges resources into resource files. When the Xcode application compiles Resource Manager resources, it sends them to a collector. After all Resource Manager resources have been compiled, the Xcode application calls | |
Takes a compiled resource ( | |
Performs universal search and replace operations on text strings in source files. See | |
Removes | |
Reverses the effects of |
Debugging and Tuning Tools
Apple provides several tools for analyzing and monitoring the performance of your software. Performance should always be a key design goal of your programs. Using the provided tools, you can gather performance metrics and identify actual performance problems. You can then use this information to fix the problems and keep your software running efficiently.
General Tools
Table C-9 lists the command-line tools available for debugging. These tools are located in <Xcode>/usr/bin and /usr/bin.
Tool | Description |
|---|---|
Lets you read, write, and delete Mac OS X user defaults. A Mac OS X application uses the defaults system to record user preferences and other information that must be maintained when the application is not running. Not all these defaults are necessarily accessible through the application’s preferences. See | |
The GNU debugger. You can use it through the Xcode application or can invoke it directly from the command line. See |
Memory Analysis Tools
Table C-10 lists the applications and command-line tools for debugging and tuning memory problems. These tools are located in <Xcode>/usr/bin and /usr/bin.
Tool | Description |
|---|---|
Lists all the objects currently allocated on the heap of the current process. It also describes any Objective-C objects, listed by class. See | |
Examines a specified process for | |
Inspects a given process and lists the | |
Displays the virtual memory regions allocated in a specified process, helping you understand how memory is being used and the purpose of memory (text segment, data segment, and so on) at a given address. See | |
Displays Mach virtual memory statistics. See |
Examining Code
Table C-11 lists the applications and command-line tools for examining generated code files. These tools are located in <Xcode>/usr/bin and /usr/bin.
Tool | Description |
|---|---|
Parses C code and outputs debugger information in the Stabs format, showing offsets of all the members of structures. For information on Stabs, see STABS Debug Format. See | |
An interactive command-line tool that allows the user to browse through C source files for specified elements of code, such as functions, function calls, macros, variables, and preprocessor symbols. See | |
Makes a tags file for the | |
Analyzes error messages and can open a text editor to display the source of the error. The | |
Lets you print, update, and verify the contents of a nib file. You can use this tool to inject localized strings into a nib file or scan the contents of a nibfile using a script. (This tool replaces the | |
Displays the symbol tables of one or more object files, including the symbol type and value for each symbol. See | |
Displays specified parts of object files or libraries. See | |
Displays information about the specified logical pages of a file conforming to the Mach-O executable format. For each specified page of code, | |
An alias to | |
Looks for ASCII strings in an object file or other binary file. See |
Performance Tools
Table C-12 lists the applications and command-line tools for analyzing and monitoring performance. For information about performance and the available performance tools, see Performance Overview. These tools are located in <Xcode>/usr/bin and /usr/bin.
Tool | Description |
|---|---|
Produces an execution profile of a C, Pascal, or Fortran77 program. The tool lists the total execution times and call counts for each of the functions in the application, and sorts the functions according to the time they represent including the time of their call graph descendants. See | |
Gathers data about the running behavior of a process. The | |
Displays an ongoing sample of system-use statistics. It can operate in various modes, but by default shows CPU and memory use for each process in the system. See |
Instruction Trace Tools
Table C-13 lists the applications and command-line tools for working with hardware-level programs. These tools are located in /usr/bin.
Tool | Description |
|---|---|
Analyzes TT6E (but not TT6) instruction traces and presents detailed analyses and histogram reports. See | |
Captures the instruction and data address stream generated by a process running in Mac OS X and saves it to disk in TT6, TT6E, or FULL format. Custom trace filters can be built using the | |
A cycle-accurate simulator of the Motorola 7400 processor that takes TT6 (not TT6E) traces as input. See | |
A cycle-accurate simulator of the IBM 970 processor that takes TT6 (not TT6E) traces as input. See |
Documentation and Help Tools
Table C-14 lists applications and command-line tools for creating or working with documentation and online help. These tools are located in <Xcode>/usr/bin and /usr/bin.
Tool | Description |
|---|---|
Merges contextual help RTF snippets into one file. This tool is included to support legacy applications. New contextual help projects do not use this tool. See | |
Gathers HeaderDoc output, creating a single index page and cross-links between documents. See | |
Generates HTML documentation from structured commentary in C, C++, and Objective-C header files. The HeaderDoc tags and scripts are described at http://developer.apple.com/darwin/projects/headerdoc/. See | |
Inserts menu entries from an Info file into the top-level dir file in the GNU Texinfo documentation system. It’s most often run as part of software installation or when constructing a dir file for all manuals on a system. See http://www.gnu.org/software/texinfo/manual/texinfo/ for more information on the GNU Texinfo system. See |
Localization Tools
Table C-15 lists the applications and command-line tools for localizing your own applications. These tools are located in <Xcode>/usr/bin and /usr/bin.
Tool | Description |
|---|---|
Decompiles the resource fork of a resource file according to the type declarations in the type declaration files you specify. You can use this utility to find strings for localization purposes, for example. DeRez works with Resource Manager resource files, not with nib files. | |
Takes the strings from C source code ( | |
Compiles the resource fork of a file according to the textual description contained in the resource description files. You can use Rez to recompile the resource files you decompiled with DeRez after you have localized the strings. |
Version Control Tools
Apple provides command-line tools to support several version-control systems. Unless otherwise noted, these tools are located in <Xcode>/usr/bin or /usr/bin.
Subversion
Table C-16 lists the command-line tools to use with the Subversion system.
Tool | Description |
|---|---|
The Subversion command-line client tool. You use this tool for manipulating files in a Subversion archive. See | |
Creates and manages Subversion repositories. See | |
Filters data dumped from the repository by a | |
Examines repository revisions and transactions. See | |
Accesses a repository using the | |
Summarizes the revision mixture of a working copy. See |
RCS
Table C-17 lists the command-line tools to use with the RCS system.
Tool | Description |
|---|---|
Stores revisions in RCS files. If the RCS file doesn’t exist, | |
Retrieves a revision from an RCS file and stores it in the corresponding working file. See | |
Creates new RCS files or changes attributes of existing ones. See | |
Checks a file into a new RCS file and uses the file’s first line for the description. | |
Generates a change log from RCS files—which can possibly be located in a CVS repository—and sends the change log to standard output. See | |
Compares the working file to the latest revision (or a specified revision) in the corresponding RCS file and removes the working file if there is no difference. See | |
Compares two revisions of an RCS file or the working file and one revision. See | |
Merges the changes in two revisions of an RCS file into the corresponding working file. See |
CVS
Table C-18 lists the command-line tools to use with the Concurrent Versions System (CVS) source control system.
Tool | Description |
|---|---|
Speeds up common versioning operations for Xcode projects that use the Apple-generic versioning system. It automatically embeds version information in the products produced by the Xcode application and performs certain CVS operations such as submitting the project with a new version number. For more information see the | |
The latest tool for managing information in the CVS repository. (Note, this tool does not support CVS wrappers.) See the | |
Wraps a directory into a GZIP format tar file. This single file can be handled more easily by CVS than the original directory. | |
Extracts directories from a GZIP format tar file created by | |
| An older version of the |
Comparing Files
Table C-19 lists the command-line tools for comparing files.
Tool | Description |
|---|---|
Compares two files or the files in two directories. See | |
Compares three files. See | |
Annotates the output of | |
Reads one or more files output by | |
Compares two files modified from the same original file and then combines all the changes into a single file. The | |
Opens FileMerge from the command line and begins comparing the specified files. See | |
Takes the output of | |
Compares two files and displays the differences so you can decide how to resolve them interactively. It then writes the results out to a file. A command-line version of FileMerge. See |
Packaging Tools
Table C-20 lists the applications and command-line tools used for packaging applications. These tools are located in <Xcode>/usr/bin and /usr/bin.
Tool | Description |
|---|---|
Creates a digital code signature for an application or software package. See | |
Copies a file or a directory, including subdirectories, preserving metadata and forks. See | |
Gets the file attributes of files in an HFS+ directory. See | |
Copies files to a target file or directory. Unlike the | |
Changes the dynamic shared library install names recorded in a Mach-O binary. See | |
Can create a multiple-architecture (“fat”) executable file from one or more input files, list the architectures in a fat file, create a single-architecture file from a fat file, or make a new fat file with a subset of the architectures in the original fat file. See | |
Merges two or more PEF files into a single file. PEF format is used for Mac OS 9 code. See | |
Creates a bill of materials for a directory. | |
Moves files, preserving metadata and forks. | |
Sets the attributes of files in an HFS+ directory. See | |
Removes the resource fork in a file or all the resource forks in the files in a specified directory and saves them alongside the original files as hidden files (a hidden file has the same name as the original file, except that it has a “dot-underscore” prefix; for example |
Scripting Tools
The tools listed in the following sections are located in <Xcode>/usr/bin and /usr/bin.
Interpreters and Compilers
Table C-21 lists the command-line script interpreters and compilers.
Tool | Description |
|---|---|
A pattern-directed scripting language for scanning and processing files. The scripting language is described on the | |
Compiles the specified files, or standard input, into a single script. Input files may be plain text or other compiled scripts. The | |
Executes a script file, which may be plain text or a compiled script. The | |
Executes scripts written in the Practical Extraction and Report Language (Perl). The man page for this command introduces the language and gives a list of other man pages that fully document it. See | |
Compiles Perl scripts. See | |
The interpreter for the Python language, an interactive, object-oriented language. Use the | |
The interpreter for the Ruby language, an interpreted object-oriented scripting language. See | |
Reads a set of files and processes them according to a list of commands. See | |
A shell-like application that interprets Tcl commands. It runs interactively if called without arguments. Tcl is a scripting language, like Perl, Python, or Ruby. However, Tcl is usually embedded and thus called from the Tcl library rather than by an interpreter such as |
Script Language Converters
Table C-22 lists the available command-line script language converters.
Tool | Description |
|---|---|
Converts an | |
Converts a |
Perl Tools
Table C-23 lists the available command-line Perl tools.
Tool | Description |
|---|---|
Displays profile data generated for a Perl script by a Perl profiler. See | |
Converts find command lines to equivalent Perl code. See | |
Converts C header files to Perl header file format. See | |
Builds a Perl extension from C header files. The extension includes functions that can be used to retrieve the value of any | |
An interactive tool that helps you report bugs for the Perl language. See | |
Looks up and displays documentation for Perl library modules and other Perl scripts that include internal documentation. If a man page exists for the module, you can use | |
Aids in the conversion of Perl 4 | |
Forces verbose warning diagnostics by the Perl compiler and interpreter. See |
Parsers and Lexical Analyzers
Table C-24 lists the available command-line parsers and lexical analyzers.
Tool | Description |
|---|---|
Generates parsers from grammar specification files. A somewhat more flexible replacement for | |
Generates programs that scan text files and perform pattern matching. When one of these programs matches the pattern, it executes the C routine you provide for that pattern. See | |
An alias for | |
Generates parsers from grammar specification files. Used in conjunction with flex to created lexical analyzer programs. See |
Documentation Tools
Table C-25 lists the available command-line scripting documentation tools.
Tool | Description |
|---|---|
Converts files from pod format to HTML format. The pod (Plain Old Documentation) format is defined in the | |
Converts files from pod format to LaTeX format. LaTeX is a document preparation system built on the TeX text formatter. See | |
Converts files from | |
Converts pod data to formatted ASCII text. See | |
Similar to | |
Checks the syntax of documentation files that are in pod format and outputs errors to standard error. See | |
Prints selected sections of pod documentation to standard output. See |
Java Tools
The tools listed in the following sections are located in /usr/bin.
General
Table C-26 lists the command-line tools used for building, debugging, and running Java programs.
Tool | Description |
|---|---|
Starts the Java runtime environment and launches a Java application. See | |
The standard Java compiler from Sun Microsystems. See | |
The Java debugger. It provides inspection and debugging of a local or remote Java virtual machine. See |
Java Utilities
Table C-27 lists some of the applications and command-line tools for working with Java.
Tool | Description |
|---|---|
Reads an Object Management Group (OMG) Interface Definition Language (IDL) file and translates it, or maps it, to a Java interface. The | |
Parses the declarations and documentation comments in a set of Java source files and produces HTML pages describing the public and protected classes, inner classes, interfaces, constructors, methods, and fields. See | |
Generates C header and source files from Java classes. The generated header and source files are used by C programs to reference instance variables of a Java object so that you can call Java code from inside your Mac OS X native application. See | |
Converts characters that are not in Latin-1 or Unicode encoding to ASCII for use with | |
A compiler that generates stub and skeleton class files for remote objects from the names of compiled Java classes that contain remote object implementations. A remote object is one that implements the interface | |
Creates and starts a remote object registry. A remote object registry is a naming service that makes it possible for clients on the host to look up remote objects and invoke remote methods. See |
Java Archive (JAR) Files
Table C-28 lists the available JAR file applications and command-line tools.
Tool | Description |
|---|---|
Checks a specified JAR file for title and version conflicts with any extensions installed in the Java Developer Kit software. See | |
Combines and compresses multiple files into a single Java archive (JAR) file so they can be downloaded by a Java agent (such as a browser) in a single HTTP transaction. See | |
Lets you sign JAR files and verify the signatures and integrity of signed JAR files. See |
Kernel Extension Tools
Table C-29 lists the command-line tools that are useful for kernel extension development. These tools are located in /usr/sbin and /sbin.
Tool | Description |
|---|---|
Loads kernel extensions, validates them to make sure they can be loaded by other mechanisms, and generates symbol files for debugging them. | |
Displays the status of any kernel extensions currently loaded in the kernel. | |
Terminates and unregisters I/O Kit objects associated with a KEXT and unloads the code for the KEXT. |
I/O Kit Driver Tools
Table C-30 lists the applications and command-line tools for developing device drivers. These tools are located in <Xcode>/usr/sbin.
Tool | Description |
|---|---|
A command-line version of I/O Registry Explorer. The | |
Displays a summary of memory allocated by I/O Kit allocators listed by type (instance, container, and | |
Shows the number of instances allocated for each specified class. This tool is also useful for tracking memory leaks. |
© 2004, 2008 Apple Inc. All Rights Reserved. (Last updated: 2008-10-15)