Debugging in the Text Editor
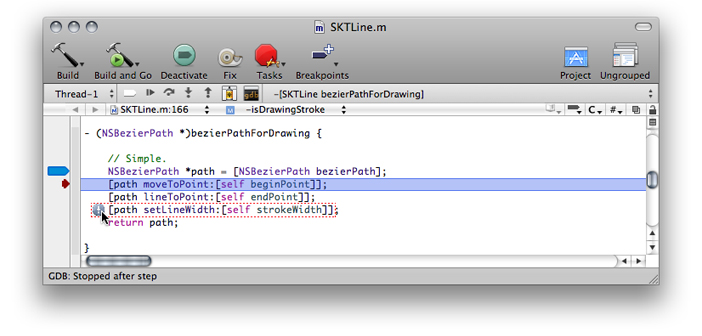
You can perform many debugging tasks in the text editor, including controlling program flow, managing breakpoints and watchpoints, and viewing program memory. Figure 2-1 shows the text editor and the debugging controls it provides.
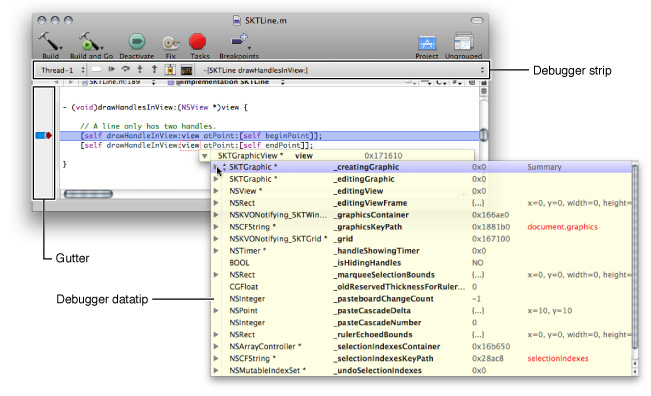
These are the controls identified in Figure 2-1:
Debugger strip. This is a small control strip that appears above the editor’s content pane while debugging.
Gutter. The gutter’s shortcut (contextual) menu gives you access to a few debugging commands.
Debugger datatips. Hovering the pointer over a variable displays the variable’s value and lets you modify it.
This chapter describes these controls in detail.
In this section:
Debugger Strip
Gutter Shortcut Menu
Debugger Datatips
Debugger Strip
The debugger strip (Figure 2-2) is a small control strip that appears above the content pane. It lets you perform several debugging tasks.
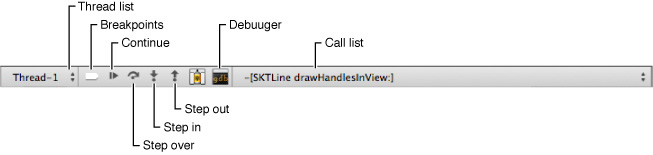
These are the items in the debugger strip:
Thread list: List of the threads in the inferior.
Breakpoints: Activates/deactivates breakpoints.
Continue: Continues execution of a paused inferior.
Step over: Steps over the current code line. The process counter (PC), identified by the red arrow in the gutter, moves to the next code line to be executed in the current file.
Step in: Steps into a function or method in the current code line. If possible, the editor shows the source file containing the called routine an the process counter appears in the code line to be executed next.
Step out: Steps out of the current function or method. The editor shows the source file containing the caller.
Debugger: Opens the Debugger window.
Call list: List of the called routines, also known as the call stack or stack frame.
Gutter Shortcut Menu
The text editor gutter includes several shortcuts to debugging facilities. The code line indicated by the pointer at the time you choose the shortcut is the action line. These include:
Continue to Here: Continues program execution up to the action line.
Add Breakpoint: Adds a breakpoint to the action line.
Add & Edit Breakpoint: Adds a breakpoint to the action line and opens the breakpoints window.
Built-in Breakpoints: Adds a predefined breakpoint to the action line.
Reveal in Breakpoints: Opens the action line’s breakpoint in the breakpoints window.
Breakpoints On: Activates breakpoints for the current debugging session.
Breakpoints Off: Deactivates breakpoints for the current debugging session.
Debugger Datatips
As you debug your program in the text editor, you may need to analyze the contents of the program’s variables as you step through code lines. Xcode provides debugger datatips to let you view and change your program’s variables. A debugger datatip is a control that provides access to the contents variables using a progressive disclosure mechanism driven by hovering the pointer over the control. You can also modify the contents of mutable variables using datatips.
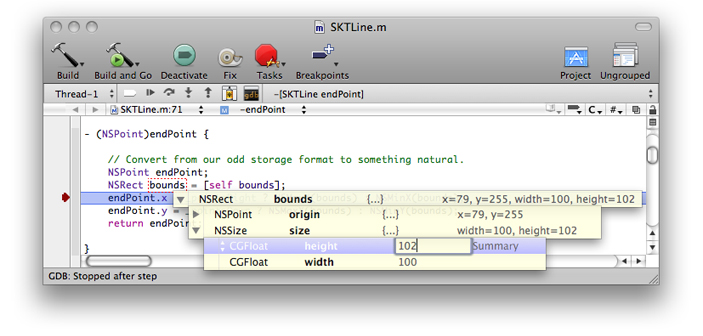
Figure 2-3 shows a debugger datatip showing the contents of the bounds variable. In addition to viewing the variable’s value, the figure shows how you can modify the value. In this case, after double-clicking the value of the height field of the size structure, you can change it to another value before executing the code line that uses the bounds variable.
As you move the pointer over a disclosure triangle in a datatip row, the contents of the field the row represents are disclosed bellow that row. (You can turn off this behavior, as explained later.) When you hover the pointer to the right of the disclosure triangle control with two small triangles appears. Clicking that control shows the datatip menu. The datatip menu provides the following commands.
Print Description: Prints the description of the current datatip field in the console.
Open in Window: Opens a window containing the data of the current datatip field.
View as Memory: Shows the contents of the current datatip field in the memory viewer window. See “Browsing Memory” for more information.
Jump to Definition: Opens the file that declares the data type of the current datatip field.
Jump to Documentation: Opens the reference for the data type of the current datatip field.
Show Types: Toggles the display of the data type of the datatip fields.
Show Data Formatters: Toggles the display of data formatters for the datatip fields.
Sort by Name: Sorts datatip fields by field name.
Sort by Type: Sorts datatip fields by field data type.
No Sort: Applies no sorting to datatip fields.
Auto Expand: Toggles the autoexpansion of datatip fields that represent structures when the pointer hovers over the corresponding disclosure triangle.
Debugger datatips also provide program-flow–control controls called step controls. Step controls allow you to perform perform Continue, Step In, and Step Over commands from the content pane of the text editor. To turn on step controls, use Run > Debugger Display > Datatips > Step Controls.
These are the commands step controls provide:
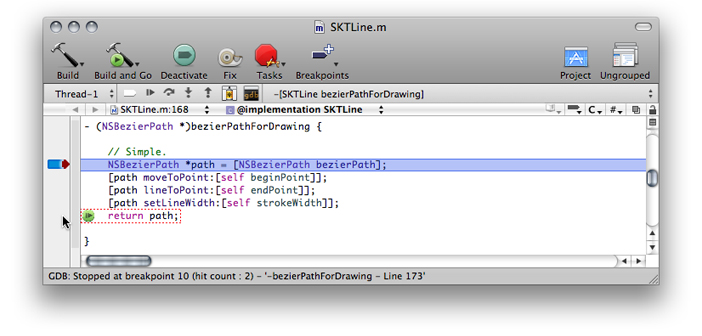
Continue to Here
To perform this command, hover the pointer over the gutter identifying the action line. The continue to here icon appears on the left margin of the line (Figure 2-4). Clicking this icon continues program execution up to the action line.
Step In and Step Over
To perform these commands, hover the pointer over the action line in the gutter or the content pane until the Step In or the Step Over icon appears on the left margin of the line (Figure 2-5). Click the icon to perform the command.
© 2009 Apple Inc. All Rights Reserved. (Last updated: 2009-01-06)