Recording Trace Data
After you decide which instruments you want to use to gather data, the next step is to choose the process you want to trace and begin recording data. How you select a process is dependent on the instruments in your trace document. Some instruments allow tracing of all system processes, others require you to record data for a single process. Some instruments even expect you to launch the process from Instruments so that they can gather data from the beginning of its execution.
Instruments provides several options for initiating a trace that make it easier to integrate Instruments into your development cycle. In this chapter, you learn how to select a process for your trace document and begin recording data using the available options in Instruments.
In this section:
Choosing Which Process to Trace
Recording Trace Data
Launching Instruments Using Quick Start Keys
Running in Mini Mode
Running Instruments from Xcode
Choosing Which Process to Trace
Before you can start collecting data, you must tell Instruments which process you want to trace. You do this by designating a target process (or processes) using the the Default Target menu in the Instruments toolbar. This menu provides the following options:
All Processes. Configures your document to trace all processes on the system.
Attach to Process. Configures your document to trace an already running process.
Launch Executable. Configures your document to launch and trace a process. (If the process is already running, Instruments launches a new copy and traces it.)
Instrument Specific. Select this item to assign different trace targets to individual instruments.
The following sections describe each of these options in more detail.
Tracing All Processes
Some instruments are capable of collecting data for all processes currently running on the computer. You can use this ability to profile a type of event or activity across the entire system. For example, you can use the Disk Activity instrument to trace all read and write operations that occur on your computer over a particular time period. To trace all running processes, choose All Processes from the Default Target menu.
Note: The All Processes item is available only if all instruments in the Instruments pane support it.
Attaching to an Existing Process
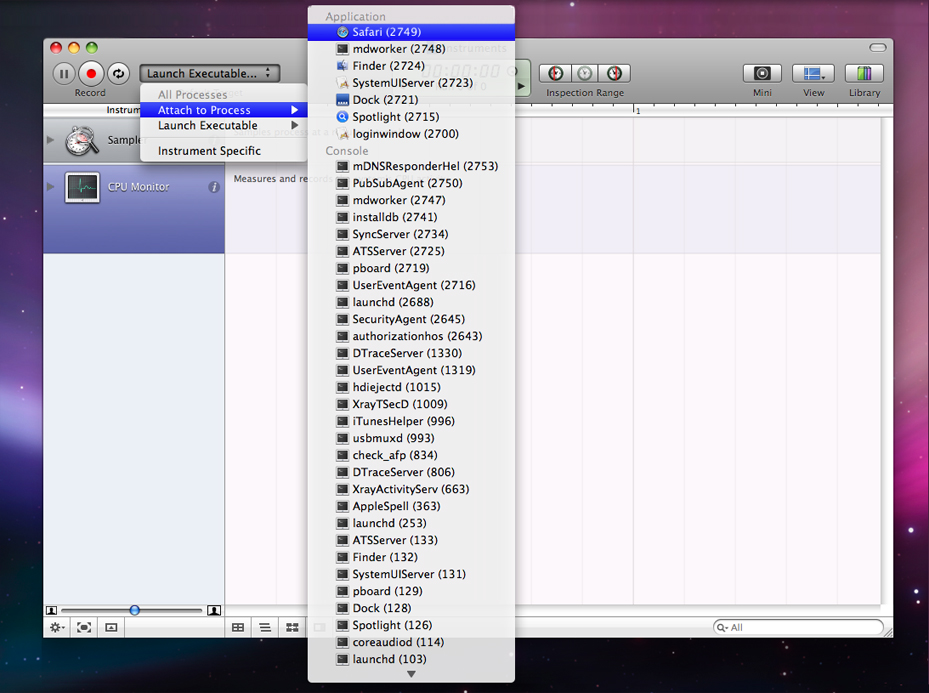
If the process you want to trace is already running on the computer, most instruments can attach to that process and start collecting data. To trace an existing process, choose Attach to Process from the Default Target menu and select the process to trace, as shown in Figure 3-1.
Launching an Executable from Instruments
If the process that you want to trace is not already running on the computer, or if you want to control the conditions under which that process is launched, choose Launch Executable from the Default Target menu. Instruments remembers any recently launched processes and adds them to the Launch Executable menu for quick access. If the process you want to launch is not in that menu, select Choose Executable to display the panel shown in Figure 3-2
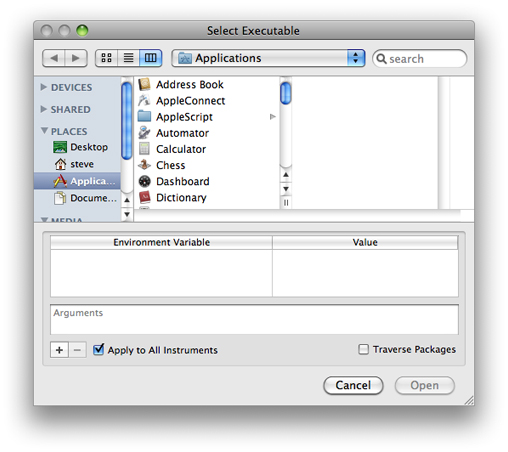
The Choose Executable panel not only lets you select the program to launch but it also lets you specify how to launch the selected program. Table 3-1 lists the additional controls in this panel and explains how you use them.
Control | Description |
|---|---|
Environment Variable | Identifies environment variables you want to set before running the process. You might use this option if your program has debugging options that are enabled using an environment variable. Use the plus (+) and minus (-) buttons to add or remove environment variables. |
Arguments | Use this field to specify any launch arguments for the application. The arguments you specify are the same ones you would use from the command line when launching the application there. |
Apply to All Instruments | Sets the specified application as the target for all instruments in the trace document. This option is enabled by default. Disabling it lets you assign different targets to different instruments in your trace document. You might use this feature when you have two copies of the same instrument or when you want to trace the behavior of two processes running side by side. |
Traverse Packages | Displays bundles (such as applications and plug-ins) as a navigable directory structure. Use this feature if the executable you want to run is inside a bundle. |
Specifying a Different Target for Each Instrument
When you choose All Processes, Attach to Process, or Launch Executable from the Default Target menu, Instruments sets the default target for all instruments to the program you choose. There are occasions, however, when you might want to set a different target for each instrument. You might want to sample two different programs at the same time, for example, using the Sampler instrument. If you have some instruments that are capable of tracing all processes, you might want them to do just that while single-process instruments sample just one process.
To assign trace targets on a per-instrument basis, do the following:
In the Default Target menu, select the Instrument Specific option.
Select one of your instruments.
Open the instrument inspector by clicking its information icon.
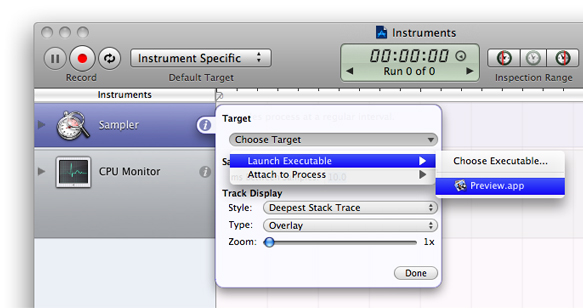
In the inspector window, use the pop-up menu in the Target section to set the target for the instrument, as shown in Figure 3-3.
Repeat steps 2 through 4 for each of your other instruments.
Recording Trace Data
After you’ve selected a process to trace, you are ready to start collecting data. Click the Record button (or choose File > Record Trace) to begin gathering the trace data. When you click Record, Instruments launches the specified executable or attaches to the specified processes and starts gathering data.
Note: When you click the Record button, Instruments may display one or more authentication panels. Many instruments require you to authenticate as an administrative user before the will record any data. Instruments is a powerful tool that enables you to see into running applications, and as such, it should be used only by authorized users.
When recording begins, the instruments start collecting data. Instruments displays the collected data in the track and Detail panes immediately. The Time control in the Instruments toolbar also shows you how much time has elapsed since you began recording. To stop collecting data, click the Stop button or choose File > Stop Trace.
During recording, if you want your program to continue running, but do not want Instruments to gather data, press the Pause button in your trace document. Instruments stops gathering data temporarily but does not stop the current recording run. Pressing the Resume button causes Instruments to continue gathering data at the current recording time. Thus, pausing and resuming leaves a data gap in the Track pane.
Launching Instruments Using Quick Start Keys
Quick Start keys are global key combinations that let you launch the Instruments application and begin collecting trace data immediately using a specific document template. You can use this feature if you are running an application and see something—such as a bug or unresponsive behavior—that you want to capture right away. You can associate different key combinations with different Instruments templates to capture different types of behavior.
To assign a Quick Start key combination, open the Instruments preferences and navigate to the Quick Start pane. This pane displays the list of Instruments templates that you can assign to key combinations. All templates start without a key combination. To assign one, find the row containing the desired template and double-click its Key column to create an editable cell. While the cell is in edit mode, press the key combination you want to use. For example, to assign the key combination Command-Option-1, press the Command, Option, and number 1 key all at the same time.
To remove a key combination from a template, select a row and press Delete.
Note: Quick Start key combinations should use at least two key modifiers (Command, Option, Control, Shift). You should avoid choosing key combinations that are commonly used by other applications.
To gather data for an application using a Quick Start Key, do the following:
Place the cursor over a window belonging to the application you want to trace.
Press the appropriate key combination to begin tracing.
Exercise the application.
When you want to stop tracing, you have two options:
Place the cursor over one of the application’s windows and press the key combination again.
Find the trace document that was opened and press the Stop button.
Because Quick Start Keys require you to move the cursor over one of the application’s windows, you can initiate multiple trace sessions for different applications using the same Quick Start Key without stopping any of the previous traces. You could also start different types of traces for the same application using different key combinations and have them all gathering data at the same time.
Running in Mini Mode
Mini mode provides a way for you to minimize the visual footprint of the Instruments application while gathering your data. When you are gathering data from certain types of applications, particularly graphics-oriented applications, there may be times when you want to gather data while remaining focused on your own application. Mini mode hides all open trace documents and in their place displays a small floating window that you can use to start and stop tracing. An added advantage of mini mode is that the Instruments application itself requires less drawing and therefore has less of an impact on system performance.
Figure 3-4 shows the mini Instruments window with several trace documents open. Instruments shows only three trace documents at a time in Mini mode, but you can use the up and down arrows to find the document you want.
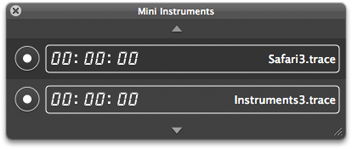
Clicking the record button next to a trace document begins recording data for that document. The document must already have its instrument and target process configured before tracing can begin. During tracing, Instruments displays the elapsed time since tracing began but displays no other instruments, controls, or data.
To enable Mini mode, click the Mini button in the toolbar of any open trace document. To disable Mini mode, click the close box in the mini Instruments window. You can also toggle between standard and mini modes by choosing choose View > Mini Instruments from the menus.
Running Instruments from Xcode
During development, you can launch your programs in Instruments directly from the Xcode user interface. This integration lets you quickly launch Instruments and gather trace data in much the same way that you would launch your program and debug it using GDB.
The Run > Start with Performance Tool menu in Xcode provides several options for launching your program using the available performance tools, including Instruments. When launching your program in Instruments, you tell Xcode which Instruments template you want to use by selecting the appropriate menu item. Xcode launches Instruments, creates a trace document using the specified template, sets the target to your program, and tells Instruments to launch your program and start recording.
In addition to the existing templates in the Start with Performance Tool menu, Xcode lets you add custom trace templates to this menu as well. For information on how to save a trace template and add it to this menu, see “Saving an Instruments Trace Template.”
© 2008 Apple Inc. All Rights Reserved. (Last updated: 2008-10-15)