Legacy Document
Important: The information in this document is obsolete and should not be used for new development.
Controlling Execution of Your Code
The purpose of the debugger is to help you identify and resolve problems in your code by analyzing the internal operation of your program. Using the debugger, you can halt the execution of your program when you encounter a problem and inspect the program in its current state. The debugger can stop your program when certain events occur or when a particular line of code is reached. It also lets you execute individual machine instructions or lines of code, pausing after each to examine the contents of your program.
This chapter shows you the various facilities that the Xcode debugger provides for pausing and then resuming execution of your program. It describes how to use breakpoints to stop at a particular line of code or at a function or method call, as well as how to stop when your program throws an exception. It also describes how to step through code, to view changes effected in your program one line or machine instruction at a time.
In this section:
Breakpoints
Stopping on C++ Exceptions
Stopping on Core Services Debugging Functions
Stepping Through Code
Stopping and Starting Your Program in the Debugger
Breakpoints
Breakpoints let you pause the execution of your program in the debugger whenever certain events occur in your code. You can set a breakpoint to stop your program when:
Execution reaches a specific line of code. When you set a breakpoint for a particular line number in a source code file, the debugger stops your program just before it executes any of the code on that line.
A particular function or method is called. You can specify the name of a function or method to set a breakpoint at the entry to that function or method; this is referred to as a symbolic breakpoint.
In Xcode, you can set and view breakpoints for a project from the code editor or from the Breakpoints window. Xcode stores all your breakpoints when you close your project and restores them when you open it again. Breakpoints are stored per-project.
GDB also supports special kinds of breakpoints that let you halt execution of your program when a particular event, such as the loading of a certain library, occurs; or when the value of an expression changes. To set breakpoints of this nature—called catchpoints and watchpoints—you must use the command line interface, described in “The Console Window.”
The Breakpoints Window
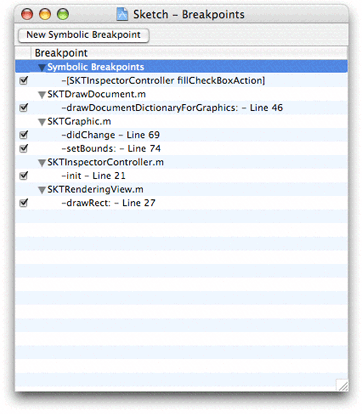
The Breakpoints window lets you view and modify all of the breakpoints set in the current project. This includes function and method breakpoints, as well as breakpoints associated with a particular line of code in a source file. To open the Breakpoints window, click the Breakpoints button in the toolbar of the debugger window or choose Debug > Breakpoints. Figure 33-1 shows the Breakpoints window:
Breakpoints on a function or method are assigned to the Symbolic Breakpoints group. File line breakpoints are grouped by the file in which they appear; Xcode displays the line number at which each breakpoint is set and the surrounding context of the line. The checkbox next to each breakpoint indicates whether that breakpoint is enabled. When a breakpoint is enabled, the debugger stops when it encounters the specified line or function.
You can delete, disable, or reenable any existing breakpoint in your project in the Breakpoints window. You can also create new symbolic breakpoints. However, you can only add a new breakpoint to a specific line of code from the editor.
To view the source code for a breakpoint, double-click the breakpoint in the Breakpoints window. This opens the source file in which the breakpoint is set or the function is defined in a separate editor window.
Adding Breakpoints
Xcode’s debugger lets you add a breakpoint to a specific line of code or to a function or method. You can set a breakpoint on a line of code directly in the editor. To set a symbolic breakpoint, use the Breakpoints window.
Setting a Breakpoint at a Line of Code
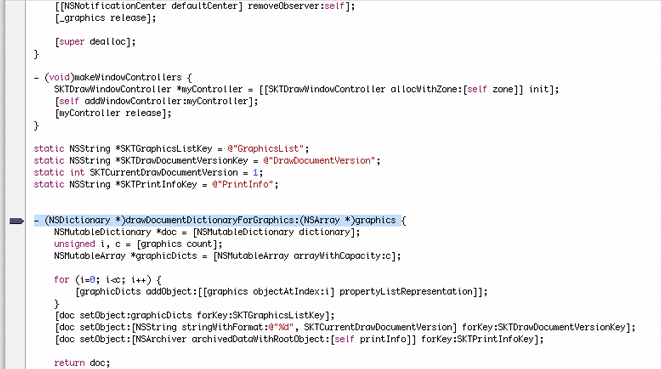
To add a file line breakpoint, click the margin beside the line of code in the code editor or place the insertion point in the line and choose Debug > Add Breakpoint at Current Line (or type Command-\). Xcode adds a breakpoint at the current line and displays it in the gutter of the editor. Breakpoints appear as a dark arrow in the gutter, pointing to the specified line of code, similar to the following:
You can easily move a breakpoint associated with a specific line of code to another line by dragging the breakpoint arrow to the new line within the code editor.
Once you’ve set a breakpoint at a particular line, you can see that breakpoint in the Breakpoints window as well, as described in the previous section. However, you cannot set a new file line breakpoint from the Breakpoints window.
Setting a Breakpoint on a Function or Method
To set a breakpoint at a function or method, use the Breakpoints
window. You can open the breakpoints window by clicking the Breakpoint
button or choosing Debug > Breakpoints. To add a new breakpoint,
click the New Symbolic Breakpoint button. Xcode adds an item to
the Symbolic Breakpoints group; type the name of the function or
method at which to set the breakpoint in this field. For example,
to stop whenever something in your code calls malloc,
enter malloc.
When you set a breakpoint on an Objective-C method, you must
include the brackets and a plus or minus sign. For example, to stop
whenever a Cocoa exception is raised, enter -[NSException
raise].
Deleting Breakpoints
If you no longer need a breakpoint, you can delete it from the project using the Breakpoints window or, if the breakpoint is set on a specific line of code, from within the code editor. To remove any breakpoint in your project—symbolic or line number—open the Breakpoints window, select the breakpoint you want to delete, and choose Edit > Delete or press the Delete key.
To remove a breakpoint that is set on a line of code, you can also do either of the following in the editor:
Click the breakpoint marker—the arrow symbol—in the gutter of the editor.
Place the insertion point in the line and choose Debug > Remove Breakpoint at Current Line.
Xcode removes the breakpoint marker from the breakpoint gutter and deletes the breakpoint from the Breakpoints window.
Disabling and Reenabling Breakpoints
In the course of debugging a program, you may find that you don’t currently want the debugger to use a particular breakpoint that you have set, but you don’t want to delete it entirely, either, in case you want to use it again at a later time. Instead of deleting the breakpoint from your project, you can simply disable it. This renders the breakpoint inactive, but retains all of the information for that breakpoint, so you can enable it again later. A disabled breakpoint appears in the breakpoint list and is saved in the project, but Xcode doesn’t stop at it. The breakpoint remains disabled until you enable it again.
You can disable or reenable any breakpoint in your project—whether a symbolic breakpoint or a line number breakpoint—from the Breakpoints window. To disable or reenable a breakpoint, open the Breakpoints window and click the checkbox beside the breakpoint you want to modify. A breakpoint is enabled when this checkbox is selected.
You can also disable or reenable file line breakpoints from the code editor by Control-clicking the breakpoint in the gutter and choosing Disable Breakpoint or Enable Breakpoint from the contextual menu. Alternatively, Command-clicking the breakpoint arrow in the gutter toggles the state of the breakpoint between enabled and disabled. A disabled breakpoint on a line of code appears as a light grey arrow in the breakpoint gutter of the code editor.
Stopping on C++ Exceptions
If you are debugging C++ code, you can specify that the Xcode debugger
stop on catch and throw.
You can enable this feature using the following two menu items in
the Debug menu:
Stop on C++ throw. Enable this option to halt execution when an exception is thrown.
Stop on C++ catch. Enable this option to halt execution when an exception is caught.
Stopping on Core Services Debugging Functions
The Core Services framework includes routines, such as Debugger and DebugStr,
that break into the debugger with a message. If your code contains
calls to these functions, you can tell Xcode’s debugger to stop
when it encounters these functions.
You can enable this feature for an individual executable,
as described in “Configuring Your Executable for Debugging,”
or for all executables in the current project using the Debug menu.
To enable stopping on calls to Debugger and DebugStr from
the Debug menu, choose Debug > Stop on Debugger()/DebugStr().
If this feature is already enabled, choosing the menu item a second
time disables it.
Xcode sets the USERBREAK environment variable to 1, which causes these functions to send a SIGINT signal to the current process, breaking into the debugger.
Stepping Through Code
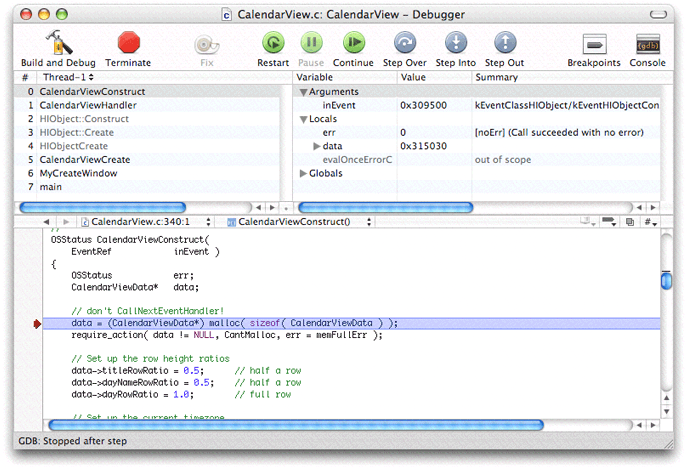
Once execution of your program has been suspended in the debugger—for example, after hitting a breakpoint—you have a number of options for resuming execution. You can simply resume execution of your program from its current location, continuing until the program exits or the debugger encounters another breakpoint, or you can step through your program’s code. When you step through code, you tell the debugger to execute just one more code line or machine instruction and pause the program once more. This lets you examine changes in your program in detail and pinpoint problems.
The Xcode debugger provides toolbar buttons and menu items
to let you control the execution of your code. The following example
uses the CalendarView sample application to illustrate how to step
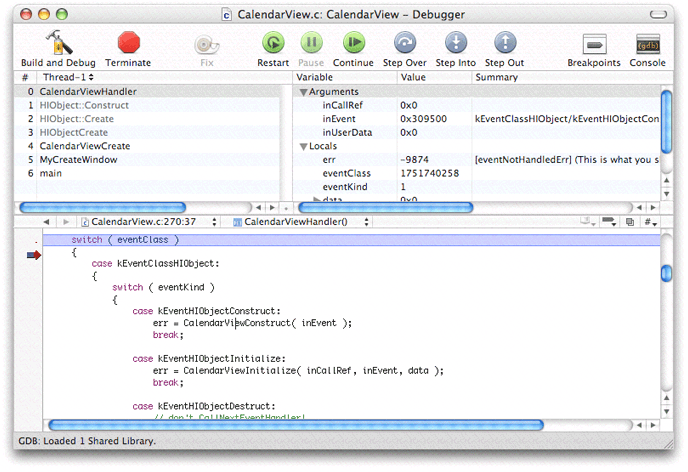
through code in the debugger using some of these commands. In Figure 33-3 the
execution of the CalendarView program is halted at a breakpoint
set in the CalendarViewHandler function.
The line of code at which execution is paused—the line at
which the breakpoint is set—is highlighted in the editor. The
red arrow next to the code line, the PC indicator, shows the position
of the program counter. You can see the chain of function calls
from which the CalendarViewHandler function
was invoked in the Thread view, located in the top left of the debugger
window. The arguments and local variables of the function or method
selected in the thread list are visible in the Variable view, to
the right of the thread list in the debugger window. To go to the
next line of code, staying within the current function, press Step
Over.
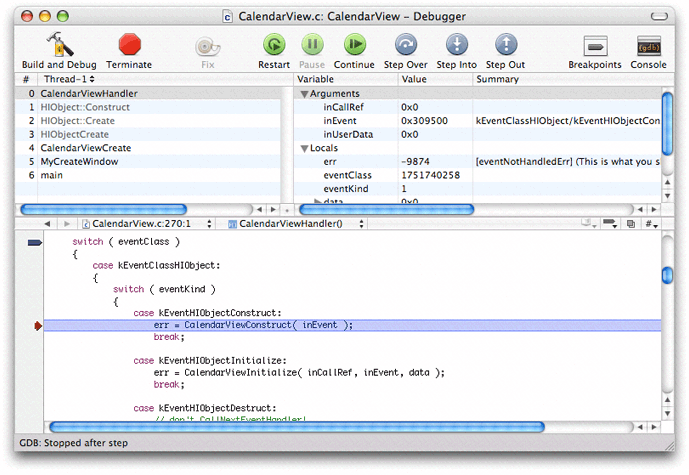
The PC indicator has advanced to the next line of code, where it is again paused. The next line of code has a function call. To go to the next line of code, stepping into the function if possible, press Step Into.
The PC indicator is now paused at a line in the CalendarViewConstruct function,
which was called from the line of code in the CalendarViewHandler function
that you stepped into. The local variables and arguments for CalendarViewConstruct are
shown in the variable display and the call chain now lists this
function above the CalendarViewHandler function.
To go to the end of the current function and back to the statement
of the CalendarViewHandler function
from which it was called, press Step Out.
You can also use the Step Into Instruction and Step Over Instruction commands to step through individual machine instructions. See “Viewing Disassembled Code and Processor Registers” for more information.
All of the commands in this section also have equivalent menu items in Xcode’s Debug menu. You can change the location at which execution will start when you continue the program or resume stepping through code by dragging the PC indicator to the appropriate line of code.
Stopping and Starting Your Program in the Debugger
In addition to the commands demonstrated in the previous section, you can further control the execution of your program in the debugger using the following commands:
To force-quit your application and restart it, press Restart.
To pause your program while it’s running, press Pause.
To continue it again, press Continue.
To force the application to quit immediately, press Terminate.
Xcode provides buttons in the Debugger window toolbar, as well as menu items in the Debug menu, for each of these commands.
© 2004, 2006 Apple Computer, Inc. All Rights Reserved. (Last updated: 2006-11-07)
