Instruments Quick Start
Instruments is a powerful tool you can use to collect data about the performance and behavior of one or more processes on the system and track that data over time. Unlike most other performance and debugging tools, Instruments lets you gather widely disparate types of data and view them side by side. In this way you can spot trends that might otherwise be hard to spot with other tools. For example, previously you had to sample a program and analyze its memory behavior during two separate execution runs. In Instruments, you can perform these tasks at the same time. You can then use the resulting data to spot trends between the code being run by your program and its corresponding memory usage.
The Instruments application uses instruments to collect data about a process over time. Each instrument collects and displays a different type of information, such as file access, memory use, and so forth. Instruments includes a library of standard instruments, which you can use as-is to examine various aspects of your code. You can configure instruments to gather data about the same process or about different processes on the system. You can build new instruments using the custom instrument builder interface, which uses the DTrace program to gather the data you want.
Note: Several Apple applications—namely iTunes, DVD Player, and Front Row, and applications that use QuickTime—prevent the collection of data through DTrace (either temporarily or permanently) in order to protect sensitive data. Therefore, you should not run those applications when performing systemwide data collection.
All work in Instruments is done in a trace document. A trace document collects the data gathered by the instruments associated with that document. Each trace document typically holds a single session’s worth of data, which is also referred to as a single trace. You can save a trace document to preserve the trace data you have gathered and open them again later to view that data.
Although most instruments are geared towards gathering trace data, one of the most sophisticated instruments helps automate the collection of data. Using the User Interface instrument, you can record user events while you gather your trace data. You can use this recording to reliably reproduce the same sequence of events over and over again. Each time you run through this sequence, your trace document gathers a new set of trace data from the other instruments in the document and presents that data side by side with previous runs. This feature lets you compare trace data as you make improvements to your code and verify that the changes you make are having the desired impact.
In this section:
Launching Instruments
Creating a Trace Document
A Tour of the Trace Document Window
Example: Performing a Quick Trace
What’s Next?
Launching Instruments
Instruments is available as part of the Xcode Tools installation. There are several ways to launch Instruments:
You can launch Instruments by double-clicking its application icon in the Finder. The Instruments application is located in <Xcode>
/Applications, where <Xcode> is the root directory of your Xcode installation. (The default root directory for an Xcode installation is the/Developerdirectory.)You can use Xcode to launch Instruments and target an executable in your project. Choose an Instruments template from the Run > Start with Performance Tool menu in Xcode. Instruments launches with the specified template ready to run the current executable, as configured in Xcode.
Note: When launching your program from an Instruments template in this manner, you must explicitly stop your executable—either from the program or from Instruments—after tracing is complete. This does not close the Instruments trace document. Instead, if you relaunch the executable, Instruments displays the new session alongside the previous one, as shown in Figure 4-2. This lets you change your code in Xcode, rebuild, run, and compare the resulting trace data to the data generated before the change.
You can launch Instruments by double-clicking an Instruments template or trace document. See “Saving and Importing Trace Data” to learn how to save an instrument configuration or user interface recording as a trace template document.
Creating a Trace Document
When you launch Instruments, the application automatically creates a new document for you. You can also create new documents by choosing File > New.
For each new document you create, Instruments prompts you to select a starting template. These templates define the initial set of instruments you plan to use in your trace document. Instruments provides several different templates, listed in Table 1-1, each geared toward different goals. You can use the Blank template if you want to add a specific set of instruments to your trace document manually. For any of the templates, you can also remove instruments you do not want.
Template | Description |
|---|---|
Blank | Creates an empty trace document to which you can add your own combination of instruments. To learn how to select and add instruments, see “Adding and Configuring Instruments.” For descriptions of the individual built-in instruments, see “Built-in Instruments.” |
Activity Monitor | Adds the Activity Monitor instrument to your document. Use this template if you want to correlate the system workload with the virtual memory size. |
CPU Sampler | Adds the Sampler and CPU Monitor instruments to your document. Use this template if you want to correlate the overall system workload with the work being done specifically by your application. |
File Activity | Adds the File Activity, Reads/Writes, File Attributes, and Directory I/O instruments to your document. Use this template if you want to examine file usage patterns in the system. This combination of instruments monitors open, close, read, and write operations on files and also monitors changes the file system itself, including permission and owner changes. |
Leaks | Adds the ObjectAlloc and Leaks instruments to your document. Use this template to monitor memory usage in your application and to detect memory leaks. (To use this template, you must launch your process from Instruments.) |
Object Allocations | Adds the ObjectAlloc instrument to your document. Use this template to monitor memory and object-allocation patterns in your program. (To use this template, you must launch your process from Instruments.) |
UI Recorder | Adds the User Interface instrument to your document. Use this template as a starting point for recording a series of user interactions with your application. You can use this feature to reproduce a series of events multiple times, gathering a new set of data during each successive run. You can then compare the sets of data knowing that the behavior that generated them was identical. Typically, you would start with this template and add additional instruments to your document to gather data. |
Core Data | Adds the Core Data Fetches, Core Data Cache Misses, and Core Data Saves instruments to your document. Use this template to monitor data store interactions in a Core Data application. |
If you do not want Instruments to ask you for a template when you create a new document, you can enable the Suppress template chooser option in the Instruments General preferences. For more information about adding and configuring the instruments in a document, see “Adding and Configuring Instruments.”
A Tour of the Trace Document Window
A trace document is a self-contained space for collecting and analyzing trace data. You use the document to organize and configure the instruments needed to collect data, and you use the document to view the data that you’ve gathered at both a high and low level.
Figure 1-1 shows a typical trace document. A trace document window presents a lot of information and therefore has to be well organized. As you work with trace documents, information generally flows from left to right. The farther right you are in the document window, the more detailed the information becomes. Table 1-2 provides descriptions for the key areas of this window.
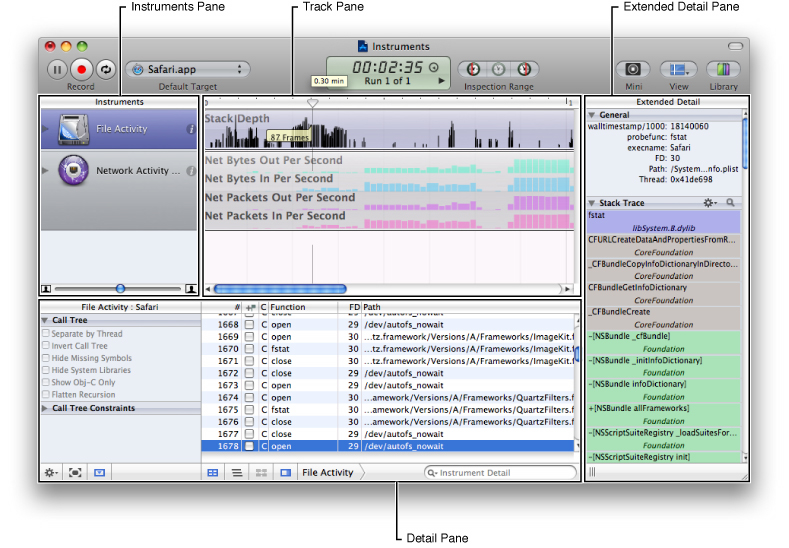
Table 1-2 lists some of the key features that are called out in Figure 1-1 and provides a more in-depth discussion of how you use that feature.
Feature | Description |
|---|---|
Instruments pane | This pane holds the instruments you want to run. You can drag instruments into this pane or delete them. You can click the inspector button in an instrument to configure its data display and gathering parameters. To learn more about instruments, see “Adding and Configuring Instruments.” |
Track pane | The track pane displays a graphical summary of the data returned by the current instruments. Each instrument has its own “track,” which provides a chart of the data collected by that instrument. The information in this pane is read-only. You do use this pane to select specific data points you want to examine more closely, however. The track pane is described in more detail in “The Track Pane.” |
Detail pane | The Detail pane shows the details of the data collected by each instrument. Typically, this pane displays the explicit set of “events” that were gathered and used to create the graphical view in the track pane. If the current instrument allows you to customize the way detailed data is displayed, those options are also listed in this pane. For more information about this pane, see “The Detail Pane.” |
Extended Detail pane | The Extended Detail pane shows even more detailed information about the item currently selected in the Detail pane. Most commonly, this pane displays the complete stack trace, timestamp, and other instrument-specific data gathered for the given event. The Extended Detail pane is described in “The Extended Detail Pane.” |
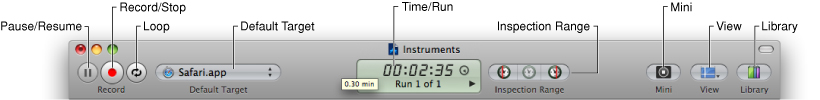
The trace document’s toolbar lets you add and control instruments, open views, and configure the track pane. Figure 1-2 identifies the different controls on the toolbar, and Table 1-3 provides detailed information about how you use those controls.
Control | Description |
|---|---|
Pause/Resume button | Pauses the gathering of data during a recording. This button does not actually stop recording, it simply stops Instruments from gathering data while a recording is under way. In the track pane, pauses show up as a gap in the trace data. |
Record/Stop button | Starts and stops the recording process. You use this button to begin gathering trace data. For more information, see “Recording Trace Data.” |
Loop button | Sets whether the user interface recorder should loop during play back to repeat the recorded steps continuously. Use this to gather multiple runs of a given set of steps. For information about playing tracks, see “Replaying a User Interface Track.” |
Default Target menu | Selects the trace target for the document. The trace target is the process (or processes) for which data is gathered. For more information on choosing a trace target, see “Choosing Which Process to Trace.” |
Time/Run control | Shows the elapsed time of the current trace. If your trace document has multiple data runs associated with it, you can use the arrow controls to choose the run whose data you want to display in the track pane. For information about trace runs, see “Viewing Trace Runs.” |
Inspection Range control | Selects a time range in the track pane. When set, Instruments displays only data collected within the specified time period. Use the buttons of this control to set the start and end points of the inspection range and to clear the inspection range. For more information, see “Viewing Data for a Range of Time.” |
Mini button | Replaces the visible Instruments trace documents with a smaller, more unobtrusive form. Use this control in situations where you want to focus on using your application. For more information, see “Running in Mini Mode.” |
View button | Displays a menu with controls for hiding or showing the Detail pane and Extended pane. For more information, see “The Detail Pane” and “The Extended Detail Pane.” |
Library button | Hides or shows the instrument library. For information on using the Library window, see “Using the Instrument Library.” |
Example: Performing a Quick Trace
To record trace data, specify the target from which you want to gather that data and press the Record button. Most instruments allow you to target a specific process on the system and some allow you to gather information for multiple processes.
The following steps show you how to create a new trace document, configure it, and record some data. The Instruments application should not be running prior to performing these steps.
Launch Instruments. The application automatically creates a new trace document and prompts you to select a template.
Select the Activity Monitor template and click the Choose button. Instruments adds the Activity Monitor instrument to the trace document.
In the Default Target menu of the trace document, select All Processes.
Click the Record button.
Wait a few seconds so that Instruments can gather some data.
Click the Stop button.
Congratulations! You have just used Instruments to gather some trace data. Instruments displays several graphs related to the system load and virtual memory size in the track pane. The Detail pane shows the list of processes that were running during the data-gathering period. You can select the different view modes in the Detail pane to see the same data organized in different ways.
What’s Next?
Now that you have been introduced to the basic concepts associated with Instruments, you can start exploring the application in more detail. The remaining chapters provide more in-depth coverage of Instruments features, including how to add and configure instruments, how to record a user interface track, how to analyze the data that you gather, and how to save the data you gather for later use.
Remember that program analysis is both an art and a science. On the scientific side, there are some guidelines that can be followed to find problems. For example, if your application has a large memory footprint, it is likely that the application will experience paging at some point, which leads to poor performance. The art comes in determining how to reduce the memory footprint because the answer for every application is different. Is the application caching too much data? Is it loading too many libraries at launch time and then not using them? Is it leaking memory? These are the questions you need to ask yourself, and Instruments is the tool you can use to find the answers.
© 2008 Apple Inc. All Rights Reserved. (Last updated: 2008-10-15)