Improving Performance
OpenGL performs many complex operations—transformations, lighting, clipping, texturing, environmental effects, and so on—on large data sets. The amount of data and the number of operations can impact performance, making your stellar 3D graphics shine less brightly than you'd like. Unless, of course, you take steps to streamline your application.
Techniques for improving data throughput and increasing program efficiency are discussed throughout this book. This chapter provides additional performance guidelines and discusses some of the tools that you can use to analyze your application.
“Best Practices” summarizes coding tips that can help achieve optimal performance and provides links to other sections, either in this chapter or elsewhere in the book, where you can read more details.
“Gathering and Analyzing Baseline Performance Data” shows how to use
topand OpenGL Profiler to obtain and interpret baseline performance data.“Identifying Bottlenecks with Shark” discusses the patterns of usage that the Shark performance tool can make apparent and that indicate places in your code that you may want to improve.
Best Practices
Each of the following sections provides information that can help your application perform optimally:
Adopt “Techniques for Working with Vertex Data” and “Techniques for Working with Texture Data” to optimize data throughput and decrease memory footprint.
Use threading appropriately. See “Multithreading and OpenGL.”
Use performance tools to assess your application and identify areas that can be optimized. See “Gathering and Analyzing Baseline Performance Data” and “Identifying Bottlenecks with Shark.”
Use Flush and Finish Routines Effectively
OpenGL commands are not executed immediately. They are queued to a command buffer and then read and executed by the hardware. The command buffer is used for vertices, normals, texture coordinates, and so forth, but not for textures themselves, which are stored elsewhere.
These functions force OpenGL to submit the command buffer to the hardware for execution.
The function
glFlushwaits until commands are submitted but does not wait for the commands to finish executing.The function
glFinishwaits for the submitted commands to complete executing.
For double-buffered contexts, the current OpenGL command buffer is not sent to the graphics processor until glFlush or glFinish is called, a buffer swap is requested, or the command buffer is full. This also applies to single-buffered contexts, although executing a buffer swap is really just an implicit call to glFlush to submit the queued commands to the renderer. This means that, for single-buffered contexts, glFlush and glFinish are equivalent to a swap operation, since all rendering is taking place directly in the front buffer.
There are only a few cases that require you to call the glFlush function:
Multithreaded applications. To keep drawing synchronized across the threads and prevent command buffer corruption, as each thread completes its command submissions, it should call
glFlush.A drawable object that changes during rendering. Before you can switch from one drawable object to another, you must call
glFlushto ensure that all commands written in the command queue for the previous drawable object have been submitted.Whenever a drawable surface in modified by one context and then used in another context, you must call
glFlushto ensure the data is serialized to the video card before you attempt to draw with it on the second context. Conversely, if you have drawn with surface that is about to get modified you should flush the context that draws the surface before the second context attempts to modify it. This applies to framebuffer objects as well as to pixel buffer objects.
When used incorrectly, glFlush or glFinish can cause your application to stall or slow down, using a higher percentage of the CPU than is necessary. You might also see visual anomalies, such as flickering or tearing. Most of the time you don't need to call glFlush or glFinish to move image data to the screen.
These are situations for which you don't need to, or should not, call glFlush:
When the scene back buffer is not complete. For best results, keep the back buffer as current as possible with a complete scene. Since the flushing and finishing routines force OpenGL to process queued commands, calling either of these when the scene in the back buffer is incomplete causes the incomplete scene to be rendered.
When calling a buffer swapping routine (the
flushBuffermethod of theNSOpenGLContextclass, theaglSwapBuffersfunction, or theCGLFlushDrawablefunction), because such functions implicitly call the OpenGL commandglFlush. Note that when using theNSOpenGLContextclass or the CGL API, the term flush actually refers to a buffer swapping operation.
Be Mindful of OpenGL State Variables
The hardware has one current state, which is compiled and cached. Switching state is expensive, so it's best to design your application to minimize state switches.
Don't set a state that's already set. Once a feature is enabled, it does not need to be enabled again. Calling an enable function more than once does nothing except waste time because OpenGL does not check the state of a feature when you call glEnable or glDisable. For instance, if you call glEnable(GL_LIGHTING) more than once, OpenGL does not check to see if the lighting state is already enabled. It simply updates the state value even if that value is identical to the current value.
You can avoid setting a state more than necessary by using dedicated setup or shutdown routines rather than putting such calls in a drawing loop. Setup and shutdown routines are also useful for turning on and off features that achieve a specific visual effect—for example, when drawing a wire-frame outline around a textured polygon.
If you are drawing 2D images, disable all irrelevant state variables, similar to what's shown in Listing 12-1.
Listing 12-1 Disabling state variables
glDisable(GL_DITHER); |
glDisable(GL_ALPHA_TEST); |
glDisable(GL_BLEND); |
glDisable(GL_STENCIL_TEST); |
glDisable(GL_FOG); |
glDisable(GL_TEXTURE_2D); |
glDisable(GL_DEPTH_TEST); |
glPixelZoom(1.0,1.0); |
// Disable other state variables as appropriate. |
Draw Only When Necessary
You can ensure that your application draws only when necessary by following a few simple guidelines:
Allow the system to regulate drawing. For example, in Cocoa use the
setNeedsDisplay:method.Use a timer effectively.
Advance an animation only when necessary. To determine when to draw the next frame of an animation, calculate the difference between the current time and the start of the last frame. Use the difference to determine how much to advance the animation. You can use the Core Foundation function
CFAbsoluteTimeGetCurrentto obtain the current time. Don't simply draw each time the system sends thedrawRect:method because the view can be redrawn for reasons other than a timer firing—such as when the user resizes the window.
Drawing is typically triggered by a timer that fires at a set interval. Timer intervals that are set to very small values (such as 0.001 to yield 1000 executions per second) degrade application performance because they consume CPU time at a far higher rate than is necessary. In most cases, drawing 30 to 60 frames per second is sufficient (.033 to .0167 seconds). You'll get the best performance if you synchronize drawing to the refresh rate of the screen, which means that you should not set the timer interval to anything faster than the refresh rate.
The code in Listing 12-2 shows how to set up a timer in the rendering loop of a Cocoa application. When using a timer in Cocoa, make sure that you do not invoke the drawRect: method from the rendering loop. Instead, allow the system to send the drawRect: message when it needs to draw. This way, the system also takes care of locking and unlocking focus on the view.
The timer code shown in Listing 12-2 is in the awakeFromNib method to ensure that the timer starts up when the application launches. The timer interval is set to 100 milliseconds, which is 10 frames per second. Note that this is slower than the refresh rate, so that there is no risk of overdriving the animation and degrading performance. The timerFired: method is called by the system each time the timer fires. When called, this method signals to the system that the display needs refreshing.
Listing 12-2 Setting up a drawing loop timer
-(void)awakeFromNib |
{ |
renderTimer = [[NSTimer scheduledTimerWithTimeInterval: |
0.1 |
target:self |
selector:@selector(timerFired:) |
userInfo:nil |
repeats:YES] |
retain]; |
} |
- (void)timerFired:(id)sender |
{ |
[self setNeedsDisplay:YES]; |
} |
Synchronize with the Screen Refresh Rate
Tearing is a visual anomaly caused when part of the current frame overwrites previous frame data in the framebuffer before the current frame is fully rendered on the screen. Applications synchronize with the screen refresh rate (sometimes called VBL, vertical blank, or vsynch) to eliminate frame tearing.
Note: During development, it's best to disable synchronization so that you can more accurately benchmark your application. Enable synchronization when you are ready to deploy your application.
The refresh rate of the display limits how often the screen can be refreshed. The screen can be refreshed at rates that are divisible by integer values. For example, a CRT display that has a refresh rate of 60 Hz can support screen refresh rates of 60 Hz, 30 Hz, 20 Hz, and 15 Hz. LCD displays do not have a vertical retrace in the CRT sense and are typically considered to have a fixed refresh rate of 60 Hz.
OpenGL blocks drawing to the display while waiting for the next vertical retrace. Applications that attempt to draw to the screen during this waiting period waste time that could be spent performing other drawing operations or saving battery life and minimizing fan operation.
Listing 12-3 shows how to use the CGL API to synchronize with the screen refresh rate, but you can use a similar approach if your application uses Cocoa or the AGL API. It assumes that you set up the context for double buffering. The swap interval can be set only to 0 or 1. If the swap interval is set to 1, the buffers are swapped only during the vertical retrace. After you set up synchronization, call the function CGLFlushDrawable to copy the back buffer to the front buffer during the vertical retrace of the display.
Listing 12-3 Setting up synchronization
long swapInterval = 1; |
CGLSetParameter (CGLGetCurrentContext(), kCGLCPSwapInterval, &swapInterval); |
Use OpenGL Macros
OpenGL performs a global context and renderer lookup for each command it executes to ensure that all OpenGL commands are issued to the correct rendering context and renderer. There is significant overhead associated with these lookups; applications that have extremely high call frequencies may find that the overhead measurably affects performance. Mac OS X allows your application to use macros to provide a local context variable and cache the current renderer in that variable. You'll get the most out of using macros when your code makes millions of function calls per second. Then you'll see a noticeable boost in imaging response.
You can use the CGL macro header (CGL/cglMacro.h) if your application uses CGL from either a Cocoa or a Carbon application, and the AGL macro header (AGL/aglMacro.h) for Carbon applications. You must define the local variable cgl_ctx or agl_ctx to be equal to the current context. Listing 12-4 shows what's needed to set up macro use for the AGL API. You use a similar approach for the CGL API. First, you need to include the correct macro header. Then, you must set the current context.
Listing 12-4 Using AGL macros
#include <AGL/aglMacro.h> // include the header |
AGLContext agl_ctx = myContext; // set the current context |
glBegin (GL_QUADS); // This code now uses the macro |
// draw here |
glEnd (); |
Use the CPU and the GPU Asynchronously
Whenever it’s feasible to do so, it's best to keep both the CPU and GPU busy and working as asynchronously as possible. You'll want to avoid pushing data through the bottleneck between the two units unless it is absolutely necessary.
These tips can help use the CPU and GPU optimally:
Consider using the GPU to perform intense mathematical computations to take some of the load off the CPU.
Use double buffering and asynchronous vertex transfer, as described in “Double Buffering Vertex Data.” If you are using the vertex array range extension, consider experimenting with triple buffers or changing buffer size.
Use asynchronous texture fetching (see “Downloading Texture Data”) rather than calling the function
glReadPixels. This call is an expensive one because it forces synchronization between the CPU and GPU, which can have the effect of stalling the rendering pipeline. Performance degrades if either the CPU or GPU is waiting for the other processing unit to catch up.Upload textures asynchronously using DMA. See “Apple Texture Range and Rectangle Texture.”
You can use OpenGL Driver Monitor to analyze how long the CPU waits for the GPU, as shown in Figure 12-2. OpenGL Driver Monitor is useful for analyzing other parameters as well. You can choose which parameters to monitor simply by clicking a parameter name from the drawer shown in the figure.
Use Appropriate Routines for Images and Pixel Data
The size of an image should guide the routine you choose to draw it. Most images you'll draw will have dimensions greater than 128 pixels by 128 pixels. It's best to treat those images as texture data. See the OpenGL Image sample application on Sample Code > Graphics & Imaging > OpenGL for an example of high performance image display.
For small images, those whose dimensions are less than or equal to 128 pixels by 128 pixels, use the OpenGL function glDrawPixels. See the Draw Pixels sample application on Sample Code > Graphics & Imaging > OpenGL for an example of the correct use of glDrawPixels.
Copying pixel data from one VRAM location to another VRAM location, for example, to an auxiliary buffer, requires an approach similar to the one used to draw image data. Perform the copy operation using the OpenGL function glCopyPixels, as shown in Listing 12-5. If you are using Cocoa, you can use the NSOpenGLPFAAuxBuffers and NSOpenGLPFAAuxDepthStencil pixel format attributes in conjunction with glReadBuffer andglDrawBuffer to set up auxiliary buffers for temporary pixel storage.
Using OpenGL for drawing images and copying pixel data can incur a performance cost if the OpenGL state is a complex one. State variables such as dithering, fog, and depth testing don't need to be enabled for 2D drawing. To ensure efficient drawing, first disable irrelevant state variables as shown in Listing 12-1.
Listing 12-5 Copying pixels
void drawRect:(NSRect) aRect |
{ |
glDrawBuffer(GL_BACK); |
glReadBuffer(GL_AUX0); |
glCopyPixels(x, y, width, height, GL_COLOR); |
} |
Retrieve Error Information Only When Debugging
When errors occur OpenGL sets an error flag that you can retrieve with the function glGetError. During development, it's crucial that your code contains error checking routines, not only for the standard OpenGL calls, but for the Apple-specific functions provided by the AGL and CGL APIs. AGL uses a mechanism for errors that's similar to OpenGL through the functions aglGetError and aglErrorString. CGL functions return error codes.
If you are developing a performance-critical application, you'll want to retrieve error information in the debugging phase. When you deploy your application you'll want to remove the error-retrieval information for all but the most critical cases. If you retrieve error codes and strings for frequently-called functions, you'll cause performance to slow down.
Use Optimal Data Types and Formats
If you don't use data types and formats that are native to the graphics processor, you'll incur a costly data conversion.
For vertex data, use GLfloat, GLshort, or GLubyte data types. Most graphics processors handle these types natively.
For texture data, you’ll get the best performance, regardless of architecture, if you use the following format and data type combination:
GL_BGRA,GL_UNSIGNED_INT_8_8_8_8_REV
These format and data type combinations also provide acceptable performance:
GL_BGRA,GL_UNSIGNED_SHORT_1_5_5_5_REVGL_YCBCR_422_APPLE,GL_UNSIGNED_SHORT_8_8_REV_APPLE
The combination GL_RGBA and GL_UNSIGNED_BYTE needs to be swizzled by many cards when the data is loaded, so it's not recommended.
Gathering and Analyzing Baseline Performance Data
Analyzing performance is a systematic process that starts with gathering baseline data. Mac OS X provides several applications that you can use to assess baseline performance for an OpenGL application:
topis a command-line utility that you run in the Terminal window. You can usetopto assess how much CPU time your application consumes.OpenGL Profiler is an application that determines how much time an application spends in OpenGL. It also provides function traces that you can use to look for redundant calls.
OpenGL Driver Monitor lets you gather real-time data on the operation of the GPU and lets you look at information (OpenGL extensions supported, buffer modes, sample modes, and so forth) for the available renderers. For more information, see OpenGL Tools for Serious Graphics Development and “Use the CPU and the GPU Asynchronously.”
This section shows how to use top along with OpenGL Profiler to analyze where to spend your optimization efforts—in your OpenGL code, your other application code, or in both. You'll see how to gather baseline data and how to determine the relationship of OpenGL performance to overall application performance.
Launch your OpenGL application.
Open a Terminal window and place it side-by-side with your application window.
In the Terminal window, type
topand press Return. You'll see output similar to that shown in Figure 12-3.The
topprogram indicates the amount of CPU time that an application uses. The CPU time serves as a good baseline value for gauging how much tuning your code needs. Figure 12-3 shows the percentage of CPU time for the OpenGL application GLCarbon1C (highlighted). Note this application utilizes 31.5% of CPU resources.Open the OpenGL Profiler application, located in
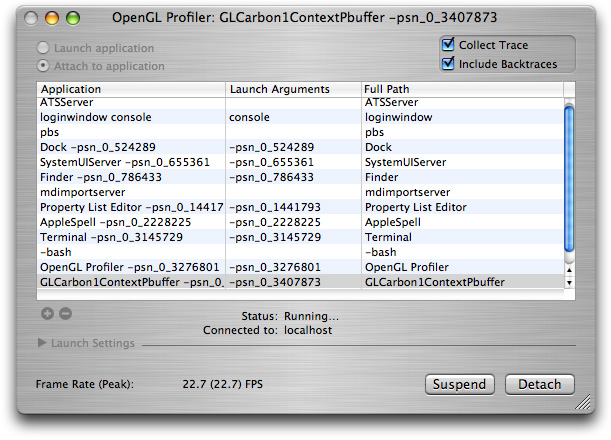
/Developer/Applications/Graphics Tools/. In the window that appears, select the options to collect a trace and include backtraces, as shown in Figure 12-4.Select Attach to application, then select your application from the Application list.
You may see small pauses or stutters in the application, particularly when OpenGL Profiler is collecting a function trace. This is normal and does not significantly affect the performance statistics. The "glitches" are due to the large amount of data that OpenGL Profiler is writing out.
Click Suspend to stop data collection.
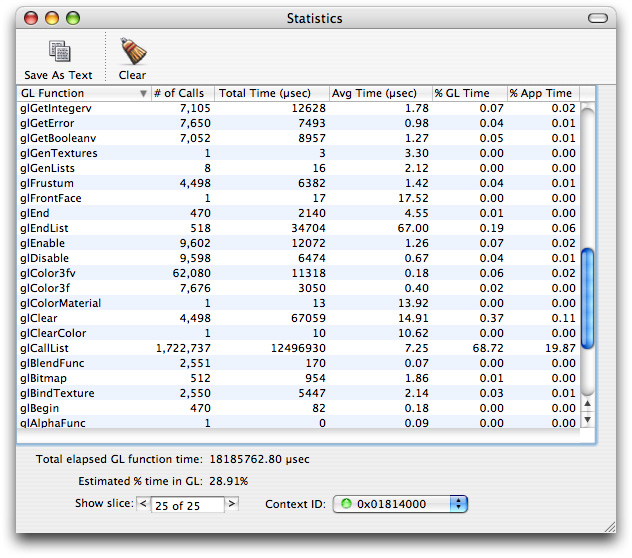
Open the Statistics and Trace windows by choosing them from the Views menu.
Figure 12-5 provides an example of what the Statistics window looks like. Figure 12-6 shows a Trace window.
The estimated percentage of time spent in OpenGL is shown at the bottom of Figure 12-5. Note that for this example, it is 28.91%. The higher this number, the more time the application is spending in OpenGL and the more opportunity there may be to improve application performance by optimizing OpenGL code.
You can use the amount of time spent in OpenGL along with the CPU time to calculate a ratio of the application time versus OpenGL time. This ratio indicates where to spend most of your optimization efforts.
In the Trace window, look for duplicate function calls and redundant or unnecessary state changes.
Look for back-to-back function calls with the same or similar data. These are areas that can typically be optimized. Functions that are called more than necessary include
glTexParameter,glPixelStore,glEnable, andglDisable. For most applications, these functions can be called once from a setup or state modification routine and only called when necessary.It's generally good practice to keep state changes out of rendering loops (which can be seen in the function trace as the same sequence of state changes and drawing over and over again) as much as possible and use separate routines to adjust state as necessary.
Look at the time value to the left of each function call to determine the cost of the call.
Determine what the performance gain would be if it were possible to reduce the time to execute all OpenGL calls to zero.
For example, take the performance data from the GLCarbon1C application used in this section to determine the performance attributable to the OpenGL calls.
Total Application Time (from
top) = 31.5%Total Time in OpenGL (from OpenGL Profiler) = 28.91%
At first glance, you might think that optimizing the OpenGL code could improve application performance by almost 29%, thus reducing the total application time by 29%. This isn't the case. Calculate the theoretical performance increase by multiplying the total CPU time by the percentage of time spent in OpenGL. The theoretical performance improvement for this example is:
31.5 X .2891 = 9.11%If OpenGL took no time at all to execute, the application would see a 9.11% increase in performance. So, if the application runs at 60 frames per second (FPS), it would perform as follows:
New FPS = previous FPS * (1 +(% performance increase)) = 60 fps *(1.0911) = 65.47 fpsThe application gains almost 5.5 frames per second by reducing OpenGL from 28.91% to 0%. This shows that the relationship of OpenGL performance to application performance is not linear. Simply reducing the amount of time spent in OpenGL may or may not offer any noticeable benefit in application performance.

Identifying Bottlenecks with Shark
Shark is an extremely useful tool for identifying places in your code that are slow and could benefit from optimization. If you are not familiar with Shark, read some of the documents listed in “See Also” that describe Shark in detail and show how to use it. Once you learn the basics, you can use it on your OpenGL applications to identify bottlenecks.
There are three issues to watch out for in Shark when using it to analyze OpenGL performance:
Costly data conversions. If you notice the
glgProcessPixelscall (in thelibGLImage.dyliblibrary) showing up in the analysis, it's an indication that the driver is not handling a texture upload optimally. The call is used when your application makes aglTexImageorglTexSubImagecall using data that is in a nonnative format for the driver, which means the data must be converted before the driver can upload it. You can improve performance by changing your data so that it is in a native format for the driver. See “Use Optimal Data Types and Formats.”Time in the
mach_kernellibrary. If you see time spent waiting for a timestamp or waiting for the driver, it indicates that your application is waiting for the GPU to finish processing. You'll see this during a texture upload. See “Double Buffering Texture Data” and “Use the CPU and the GPU Asynchronously” for ideas on how you might optimize asynchronous behavior between the CPU and the GPU.Misleading symbols. You may see a symbol, such as
glgGetString, that appears to be taking time but shouldn't be taking time in your application. That sometimes happens because the underlying optimizations performed by the system don't have any symbols attached to them on the driver side. Without a symbol to display, Shark shows the last symbol. You need to look for the call that your application made prior to that symbol and focus your attention there. You don't need to concern yourself with the calls that were made "underneath" your call.
See Also
If you are unfamiliar with general performance issues on the Macintosh platform, you will want to read Getting Started with Performance and Performance Overview. Performance Overview contains general performance tips that are useful to all applications. It also describes most of the performance tools provided with Mac OS X, including:
Analysis tools—MallocDebug, ObjectAlloc, OpenGL Profiler, Sampler, Saturn, Shark,
heap,leaks, andvmmapMonitoring tools—BigTop, Quartz Debug, Spin Control, Thread Viewer,
fs_usage,sc_usage, andtopHardware analysis tools—CacheBasher, MONster, PMC Index, Reggie SE, Skidmarks GT,
acid,amber,simg4, andsimg5Assorted command-line tools—
atos,c2ph,gprof,kdump,malloc_history,nm,otool,pagestuff,pstruct,sample,vm_stat
There are two tools other than OpenGL Profiler that are specific for OpenGL development—OpenGL Driver Monitor and OpenGL Shader Builder. OpenGL Driver Monitor collects real-time data from the hardware. OpenGL Shader Builder provides immediate feedback on vertex and fragment programs that you write.
For more information on these tools, see:
Shark User Guide, available by launching Shark and choosing Help > Shark Help.
The following books contain many techniques for getting the most performance from the GPU:
GPU Gems: Programming Techniques, Tips, and Tricks for Real-Time Graphics, Randima Fernando.
GPU Gems 2: Programming Techniques for High-Performance Graphics and General-Purpose Computation, Matt Pharr and Randima Fernando.
© 2004, 2008 Apple Inc. All Rights Reserved. (Last updated: 2008-06-09)